Download
1 / 11
120 likes | 232 Vues
This project analyzes the impact of planned bus service cuts in Los Angeles on minority and low-income riders. It focuses on the redistribution and demographic effects in South and Southeast LA neighborhoods. The study includes mapping of affected areas and a review of transit dependency indices to assess the implications of reduced service. Future steps involve data analysis and network optimization to mitigate the negative consequences of the cuts.

E N D
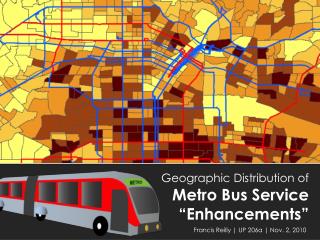
Geographic Distribution ofMetro Bus Service “Enhancements” Francis Reilly | UP 206a | Nov. 2, 2010
Project Overview • The Metro Board of Directors has approved changes to bus service that will reduce Metro’s bus service by about 3.7 percent, effective Dec. 12, 2010. The cuts include the elimination of five Rapid bus lines, including the 711, 714, 715, 753 and 920, although local service will be enhanced to mitigate the effects. • The Bus Riders’ Union contends that these cuts will mean longer waits, more overcrowding, and more transfers, resulting in added financial burden to bus riders. Further, the BRU points out that the cuts will affect South and Southeast LA the hardest, where 3 rapid lines and 5 local lines were cut, and greatly affects minority and low-income riders. These cuts represent a rollback of Metro’s consent decree with the BRU from their 1994 Title VI lawsuit. • This mapping project looks at the distribution of the service cuts and the demographics of the surrounding neighborhoods.
Rapid Bus Routes & Percent Minority Residents Skills: Inset map, Rapid routes coded thru attribute sub-set selection
Census Tracts: Percent Minority Central LA County has a heavy concentration of minorities & is where Rapid routes are focused. Skills: Aggregate attribute fields Percent Minority = [(Pop. Black + Pop. Hispanic) / Total Pop.] * 100
Heavier transit use (relative to LA) in almost all areas with Rapid lines. Workers Commuting by Transit Skills: Point graduated symbol
Workers Commuting by Transit (Downtown Inset) Density of transit use downtown and in minority neighborhoods.
Transit Dependency Index Transit Dependency Index = {[zero car hholds] + [<15,000 hhold income]}/10 Skills: Index
Rapid Service Cuts with ½ Mile Buffer Buffer created to estimate ped shed. Skills: Buffering
Next Steps • Look at boardings data & redundant routes • Extract info from buffer • Perform network analysis Skills: Charts/images
References • ESRI shapefiles (http://arcdata.esri.com/data/tiger2000/tiger_download.cfm) • Metro Rapid shapefiles (http://developer.metro.net/) • US Census 2000 Summary File 3 (http://factfinder.census.gov/servlet/DatasetMainPageServlet?_program=DEC&_submenuId=datasets_1&_lang=en)