Download
1 / 25
370 likes | 786 Vues
ODOR AND CORROSION CONTROL IN SEWERAGE SYSTEMS. Enrique J. La Motta, Ph.D., P.E. Professor of Civil and Environmental Engineering THE SOUTHEAST SYMPOSIUM ON CONTEMPORARY ENGINEERING TOPICS (SSCET ) University of New Orleans September 2014. PRESENTATION OUTLINE.

E N D
ODOR AND CORROSION CONTROL IN SEWERAGE SYSTEMS Enrique J. La Motta, Ph.D., P.E. Professor of Civil and Environmental Engineering THE SOUTHEAST SYMPOSIUM ON CONTEMPORARY ENGINEERING TOPICS (SSCET) University of New Orleans September 2014
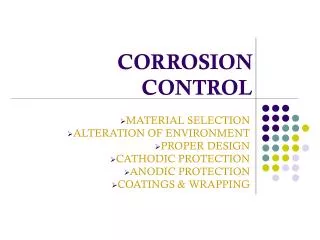
PRESENTATION OUTLINE • Cause of H2S odor and corrosion • Odor and corrosion control technology overview • Problems and solution in NO metropolitan area • Pure oxygen injection • Applications and case studies
Bacteria need oxygen to consume org. matter MAIN CAUSE OF ODOR • Oxygen sources • (order of preference): • Oxygen (limited) • Nitrate (limited) • Sulfate (unlimited)
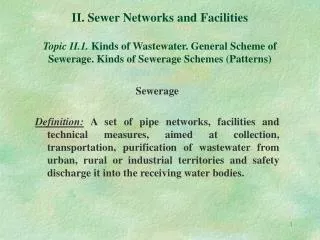
Sulfide Generation in Sewers Anaerobic bacteria H2S SO42- Anaerobic slime layer Condensate: Location of H2S oxidizing bacteria H2S is released from solution as gas (rotten egg odor) Anaerobic slime layer Corrosion of moist pipe surface Thiobacillus H2SO4 H2S + O2 sulfuricans (EPA Manual)
EFFECTS OF SEWER CORROSION (Vitrified Clay Pipe Manual)
RATE OF CORROSION At H2S concentrations of 20ppm in the headspace, concrete will corrode at a rate of 1 inch in 5 years (Clidence and Shissler, 2008)
MAJOR H2S CORROSION TARGET AREAS • Gravity concrete or cast iron sewers • Pump stations and force mains • Treatment facilities
TREATMENT OBJECTIVES • Maintain DO > 0.5 mg/L. • Keep dissolved sulfides (DS) less than 0.1 (difficult and costly to achieve) to 0.3 mg/L. • Maintain H2S in the air at less than 3 to 5 ppm. • Increase pipe crown pH to 4.0 or higher
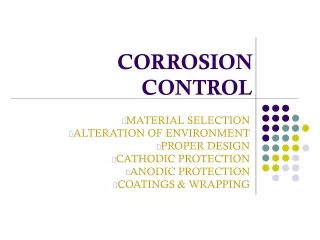
TECHNIQUES AVAILABLE TO CONTROL H2S CORROSION • Oxidations systems: • Pure oxygen injection • Air injection • Hydrogen peroxide • Chlorine • Potassium permanganate. • Precipitation systems • Iron salts • Zinc salts • pH elevation • Other methods
HYDROGEN SULFIDE CONTROL AT ORLEANS PARISH • Significant amount of sulfide generation occurs in the sanitary sewer systems of the New Orleans metropolitan area. • Orleans Parish produces approximately 120 MGD of municipal wastewater • S&WB has tried hydrogen peroxide and Bio-Kat addition • Roughly 24 MGD is being treated with Bio-Kat • The annual cost of Bio-Kat ≈0.6 million dollars • The unit cost is roughly $25,000 per MGD treated.
BEST METHOD: PURE OXYGEN INJECTION • A more cost-effective H2S control system is wastewater super-oxygenation. • Oxygen can be generated in situ using modern technology. • Pure oxygen is injected at selected sewage pumping stations. • High oxygen transfer efficiency (>90%)
Typical in situ oxygen generation system using the pressure swing adsorption (PSA) technology (Source: OGSI.)
Schematic diagram of the ECO2 oxygen injection system. (Clidence and Shissler, 2008).
Typical installation of the ECO2 pure oxygen injection system at a raw sewage pumping station (Source: ECO2 web site)
ADVANTAGES OF PURE OXYGEN INJECTION • Wastewater remains aerobic through the treatment plant: • No H2S generation • No odors • No corrosion • Wastewater arrives partially treated to the treatment plant • Modern technology makes this system cost effective • Examples of positive results:
Untreated H2S levels in the Laguna Beach force main Source: Clidence and Schissler, WEF/A&WMA, 2008
H2S levels in the Laguna Beach force main after pure oxygen injection. Source: Clidence and Schissler, WEF/A&WMA, 2008
H2S in the sewer headspace near Gulf Pond force main discharge, Milford, Conn. Source: Bradstreet and Smith, WEFTEC 2012
Cost of pure oxygen injection systems • Milford, Conn.: Unit annual cost = $5,400/MGD • Madison, ME: Unit annual cost = $5,200/MGD • Elk Vale, SD: Unit annual cost = $5,400/MGD • Trinity River Authority, Dallas, TX (primary clarifiers, 150 MGD): Unit annual cost = 1,700/MGD • The cost of super-oxygenation for H2S and corrosion control is close to one-fifth of the cost of Bio-Kat.
HYDROGEN SULFIDE CONTROL AT JEFFERSON PARISH • Jefferson Parish tried iron salts addition on West Bank • At Marrero WWTP got black precipitate (Fe2S) all over the plant • Got Fe(HO)3 precipitate at the chlorination chamber • Suspended iron salt addition in 1997. • Severe odor and corrosion problems at the East Bank Wastewater Treatment Plant • UNO has been cooperating with JP by developing a pure oxygen injection program
Pure Oxygen Injection At JP East Bank Pumping Station System • Assumptions made to calculate oxygen demand: • Oxygen concentration to meet the oxygen uptake rate = 10 x HRT. • HRT was based on continuous flow at average dry weather flow rate • Oxygen concentration needed to oxidize hydrogen sulfide = 5 x DS at each pumping station. • DS data base was limited. • Calculations were performed, and several changes and adjustments were made. • Final amounts of oxygen to be added are on the next diagram.
E6-7 Transcont. & Vineland 8153.3 gpm 32.66 ft G6-9 Helios 3340.4 gpm 55.1 ft F6-2 W. Napoleon 8065.0 gpm 66.64 ft F6-11 Houma & W. Napoleon 2012.6 gpm 66.4 ft G6-4 Galleria 3795.5 gpm 60.1 ft 3.7 fps 0.77 fps 7136 gpm 1.27 fps 14,571.8 gpm 2.04 fps 10,102.5 gpm 1.79 fps 12,115.1 gpm 2.15 fps 22,636.8 gpm 2.12 fps F6-5 Clearview & W. Napoleon 2456.7 gpm 46.0 ft F6-5 Cleary & W. Napoleon 2966.6 gpm 53.8 ft 30,790.0 gpm 2.89 fps E5-4 Transcontinental & W. Metairie 3384.6 gpm 42.6 ft 34,174.6 gpm 2.69 fps EBWWTP SCHEMATIC DIAGRAM OF THE EAST BANK SEWAGE PUMPING SYSTEM
SECOND PHASE, JEFFERSON PARISH • Implement the oxygen injection program. • Monitor the successful removal of hydrogen sulfide in the pumping system. • Monitor the remaining odor levels at the EB WWTP. • If odors continue, focus on improving the sludge management system. • Inject pure oxygen into sludge holding tank.