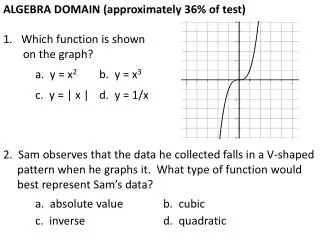
Warm Up How does each function compare to its parent function?
Warm Up How does each function compare to its parent function?. 1. f ( x ) = 2( x – 3) 2 – 4. vertically stretched by a factor of 2, translated 3 units right, translated 4 units down. 2. g ( x ) = (– x ) 3 + 1. reflected across the y -axis, translated 1 unit up. Objectives.

Warm Up How does each function compare to its parent function?
E N D
Presentation Transcript
Warm Up How does each function compare to its parent function? 1. f(x) = 2(x – 3)2 – 4 vertically stretched by a factor of 2, translated 3 units right, translated 4 units down 2. g(x) = (–x)3 + 1 reflected across the y-axis, translated 1 unit up
Objectives Transform exponential and logarithmic functions by changing parameters. Describe the effects of changes in the coefficients of exponents and logarithmic functions.
You can perform the same transformations on exponential functions that you performed on polynomials, quadratics, and linear functions.
Example 1: Translating Exponential Functions Make a table of values, and graph g(x) = 2–x+ 1. Describe the asymptote. Tell how the graph is transformed from the graph of the function f(x) = 2x. The asymptote is y = 1, and the graph approaches this line as the value of x increases. The transformation reflects the graph across the y-axis and moves the graph 1 unit up.
1 1 1 1 16 8 4 2 Check It Out! Example 1 Make a table of values, and graph f(x) = 2x – 2. Describe the asymptote. Tell how the graph is transformed from the graph of the function f(x) = 2x. The asymptote is y = 0, and the graph approaches this line as the value of x decreases. The transformation moves the graph 2 units right.
2 2 2 A. g(x) = (1.5x) 3 3 3 The graph of g(x) is a vertical compression of the parent function f(x) 1.5x by a factor of . y-intercept: Example 2: Stretching, Compressing, and Reflecting Exponential Functions Graph the function. Find y-intercept and the asymptote. Describe how the graph is transformed from the graph of its parent function. parent function: f(x) = 1.5x asymptote: y = 0
Example 2: Stretching, Compressing, and Reflecting Exponential Functions B. h(x) = e–x + 1 parent function: f(x) = ex y-intercept: e asymptote: y = 0 The graph of h(x) is a reflection of the parent function f(x) = ex across the y-axis and a shift of 1 unit to the right. The range is {y|y > 0}.
Check It Out! Example 2b g(x) = 2(2–x) parent function: f(x) = 2x y-intercept: 2 asymptote: y = 0 The graph of g(x) is a reflection of the parent function f(x) = 2x across the y-axis and vertical stretch by a factor of 2.
Because a log is an exponent, transformations of logarithm functions are similar to transformations of exponential functions. You can stretch, reflect, and translate the graph of the parent logarithmic function f(x) = logbx.
Remember! Transformations of ln x work the same way because lnx means logex.
Example 3A: Transforming Logarithmic Functions Graph each logarithmic function. Find the asymptote. Describe how the graph is transformed from the graph of its parent function. g(x) = 5 log x – 2 asymptote: x = 0 The graph of g(x) is a vertical stretch of the parent function f(x) = log x by a factor of 5 and a translation 2 units down.
Check It Out! Example 3 Graph the logarithmic p(x) = –ln(x + 1) – 2. Find the asymptote. Then describe how the graph is transformed from the graph of its parent function. asymptote: x = –1 The graph of p(x) is a reflection of the parent function f(x) = ln x across the x-axis 1 unit left and a shift of 2 units down.
Example 4A: Writing Transformed Functions Write each transformed function. f(x) = 4x is reflected across both axes and moved 2 units down. f(x) = 4x Begin with the parent function. g(x) = 4–x To reflect across the y-axis, replace x with –x. To reflect across the x-axis, multiply the function by –1. g(x) = –4–x = –(4–x)– 2 To translate 2 units down, subtract 2 from the function.
f(x) = ln xis compressed horizontally by a factor of and moved 3 units left. 1 2 Example 4B: Writing Transformed Functions g(x) = ln2(x + 3) When you write a transformed function, you may want to graph it as a check.
Check It Out! Example 4 Write the transformed function when f(x) = log x is translated 3 units left and stretched vertically by a factor of 2. g(x) = 2 log(x + 3) When you write a transformed function, you may want to graph it as a check.
Example 5: Problem-Solving Application The temperature in oF that milk must be kept at to last n days can be modeled by T(n) = 75 – 16 ln n. Describe how the model is transformed from f(n) = ln n. Use the model to predict how long milk will last if kept at 34oF.
3 Solve Example 5 Continued Rewrite the function, and describe the transformations. T(n) = 75 – 16 ln n Commutative Property T(n) = –16 ln n + 75 The graph of f(n) = ln n is reflected across the x-axis, vertically stretched by a factor of 16, and translated 75 units up.
3 Solve –41 = ln n –16 41 16 e = n Example 5 Continued Find the number of days the milk will last at 34oF. 34 = –16ln n + 75 Substitute 34 for T(n). –41 = –16ln n Subtract 75 from both sides. Divide by –16. Change to exponential form. n ≈ 13 The model predicts that the milk will last about 13 days.