Download
1 / 96
960 likes | 1.19k Vues
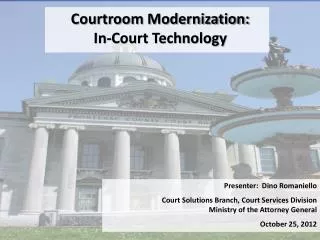
From the Classroom to the Courtroom: How to use Technology and Graphics to Create an Effective and Persuasive Presentation. Jon Lutz Research Workshop Series Spring 2011. http://www.law.fsu.edu/library/databases/ppt/presentationgraphics.ppt. TextPulls.

E N D
From the Classroom to the Courtroom:How to use Technology and Graphics to Create an Effective and Persuasive Presentation Jon Lutz Research Workshop Series Spring 2011 http://www.law.fsu.edu/library/databases/ppt/presentationgraphics.ppt
TextPulls • A text pull is when a small selection of text is pulled out and quoted in a larger font type
TextPull, example 1 Public participation in local government comprehensive land use planning benefits Florida’s natural resources, scenic beauty and citizens.
TextPull, example 2 Public participation in local government comprehensive land use planning benefits Florida’s natural resources, scenic beauty and citizens.
TextPull, example 3 Public participation in local government comprehensive land use planning benefits Florida’s natural resources, scenic beauty and citizens.
To Create a TextPull • Four Parts • The Scan • The Pull • The Citation • The Highlighting
SNAGIT • You can get SNAGIT at: http://www.techsmith.com/snagit.asp
Image Editors • Almost any image editing software will allow you to crop or resize graphics • Examples: Photoshop, Paint Shop Pro or Lview Pro
The Pull • The purpose of the pull is to single out an important sound bite from an essential document.
Ways to Pull Text • Type • This usually gives the clearest result • Blow up image • Especially useful if it is something like a signature or a handwritten note • Sometimes a combination is best • An image of the full page and then a pull that is retyped.
The Citation • Text pulls should be carefully cited • Both descriptively • Letter of 10/20/99 from X to Y • And trial identification • Exhibit number
Citation, example Public participation in local government comprehensive land use planning benefits Florida’s natural resources, scenic beauty and citizens. #SC06-161 – Advisory Opinion to the Attorney General re: Referenda Required for Adoption and Amendment of Local Government Comprehensive Land Use Plans
Highlighting • Highlighting the text in the original document shows where the pulled text is located. • This helps to authenticate the pull • It also emphasizes important information
Highlighting • Most programs that allow editing have a highlighting feature • Adobe Acrobat under Tools/Commenting/Highlight Text Tool • MS Powerpoint on the Drawing Toolbar, draw a rectangle around the object you want highlighted, right click and choose Format Auto Shape then set the background color. • In MS Word, on the formatting toolbar, click highlighting
PowerPoint Drawing Feature • To use PowerPoints drawing feature • For Office 2003 Click on View and then under Toolbars make sure Drawing is checked • For Office 2007 and 2010 go to the Insert ribbon
Powerpoint Drawing • The drawing bar will appear at the bottom of your PowerPoint display if using PowerPoint 2003
Other Types of TextPulls • Juxtaposed Textpulls • Compares text from two or more sources to show either convergence or divergence • Thematic Textpulls • May show multiple quotations on the same topic or issue • Supporting Textpulls • Used to supplement other sources such as a timeline
Timelines • A timeline is a way of organizing events in chronological order
Timelines • Most timelines are divided into two or three parts • The timebar • Written entries • And possibly icons or graphics to visually communicate an important event.
Timebar, example 1 Date Put text describing event here Date Put text describing event here Date Icon, graphic, textpull here JAN FEB MAR APR MAY JUN JULY AUG
Types of Timelines • Macrotimelines • Microtimelines • Topical timelines • Action/Reaction Timelines
Macrotimelines • The view from a height
Microtimelines • Use a microtimeline with a macrotimeline to focus on smaller but important time periods
Microtimeline of Previous 1895 1985 1930-1934 Creation of Union of Soviet Writers Formulation of Socialist Realism First all-Union Congress of Soviet Writers Union Adopts Socialist realism (in by-laws) Suicide of Mayakovsky 1930 1931 1932 1933 1934
Other Types of Timelines • Segmented timelines • Breaks content into phases or segments • Layer Cake timelines • Breaks content into layers with different content in each layer • Sequential timelines • Use when the date of events is less important than the sequence of events • Juxtaposed timelines • Used to compare or contrast information
PowerPoint Flowchart Feature • From the drawing toolbar click on AutoShapes and then Flowchart • Drag the shape you want into the PowerPoint presentation
PowerPoint Shapes With Office 2010 go to the Insert ribbon and choose Shapes.
Flowchart • In PowerPoint 2007 you can use SmartArt graphic to make a flowchart
Adding Animations • Add an Animation
Custom Animation Animations work about the same in both earlier versions of PowerPoint. For 2010 version go the Animations tab.
Add a Chart • Choose a slide layout that will allow you to add a chart
Add a Chart • Click on Insert Chart • You can then edit the datasheet to change the content of the chart • Or you can insert a chart from an Excel file
Chart, example 3 Gallons per Day per Capita
PowerPoint vs. Posters • When to use PowerPoint and when not to use PowerPoint – That is the question.