Download
1 / 16
170 likes | 414 Vues
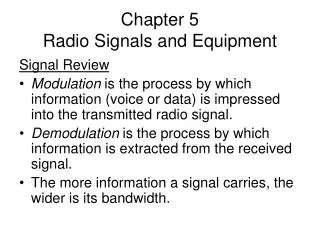
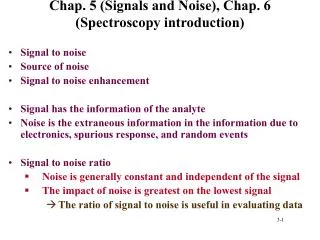
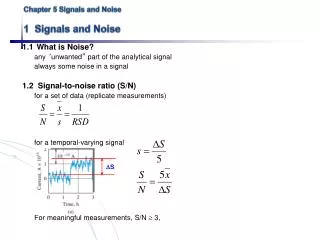
Chapter 5 Signals and Noise 1 Signals and Noise. 1.1 What is Noise? any ‘ unwanted ” part of the analytical signal always some noise in a signal 1.2 Signal-to-noise ratio (S/N) for a set of data (replicate measurements) for a temporal-varying signal

E N D
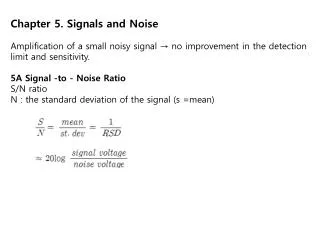
Chapter 5 Signals and Noise1 Signals and Noise 1.1 What is Noise? any ‘unwanted” part of the analytical signal always some noise in a signal 1.2 Signal-to-noise ratio (S/N) for a set of data (replicate measurements) for a temporal-varying signal For meaningful measurements, S/N 3, S
2 Sources of Instrumental Noise (characterized by their frequency) 2.1 White Noise – amplitude invariant with respect to frequency Thermal Noise -voltage fluctuation due to random electron motions in the resistive elements k: Boltzmann’s constant T: absolute temperature R: resistance f: frequency bandwidth,
Shot Noise -current fluctuations due to random motion of electrons cross a junction (e.g., PN interface, space between anode/cathode) I: average current e: charge of electron
2.2 Flicker Noise – amplitude varies with 1/f, drift in instruments
2.3 Environmental Noise - different forms of noise that arise from the surroundings - some occurs at known discrete frequencies - some unpredictable, and difficult to correct (e.g., TV stations, computers, motors,etc)
2.4 Composite Noise Spectrum 2.4 Composite Noise Spectrum Fig. 5-3 (p.113)
3 Strategies for S/NEnhancement • White Noise reduce f, temp, resistance, and I • Flicker Noise make measurements at frequencies >100kHz • Shielding & Grounding absorbing electromagnetic noise But signal • often at or near dc (low freq) • often directly proportional to resistance • often directly proportional to current • often measured with transducers having very large f (fast response, PMT f >107Hz)
3.1 Reducing f (white noise) 3.1.1 Analog filtering: low-pass RC circuit A slow varying dc signal containing high frequencies with bandwidth extending over wide range Fig. 5-5 (p.115) High-frequency components rejected, and f reduced
3.1.2 Digital filtering: Fourier transform/smooth control in the frequency domain by manipulating pass function Fig. 5-12 (p.121) • It is easy to smooth/filter signal as well as noise. Make sure that the result is not distorted • trade-off between resolution and noise. Need high point density to prevent losing information.
3.2 Increasing f (flicker noise) • We need to move f to >100kHz… • How? -Modulate: encode analytical signal at a high frequency, where 1/f noise is negligible - Amplify the signal at the modulation frequency, while reduce the noise. - demodulate the signal
Lock-in Amplifier Chopper 1. Modulate 2. Amplify modulated signal Fig. 5-8 (p.117) 3. Demodulate
3.3 Signal Averaging • Total intensity of signal: increase linearly with the number (n) of replicate signals • Noise: increase as (n)1/2 • S/N increase as (n)1/2
3.3.2 Signal Averaging For a Spectrum Get S/N increased with n½ Need good synchronization for replicate scan Fig. 5-10 (p.119)
3.3.3 Boxcar Averaging • A approach for smoothing irregularities • A single –channel signal averager select a single delay time integrated signal over selected gate time average signal for n-replicate repeat at new delay time S/N increases with (averaging time)1/2 Fig. 5-11 (p.119)
3.3.3 Boxcar Averaging select a single delay time integrated signal over selected gate time average signal for n-replicate repeat at new delay time Fig. 5-11 (p.119)