Download
1 / 22
250 likes | 836 Vues
UNIT 3: Analyzing Informational Text. LESSON 2: Evaluating Graphics in Procedural Text. Content Objective. What am I doing today? I CAN... evaluate the use of images in expository texts. How can images enhance the message in expository texts?. BRAINSTORM. IDENTIFY.

E N D
UNIT 3: Analyzing Informational Text LESSON 2: Evaluating Graphics in Procedural Text
Content Objective What am I doing today? I CAN... evaluate the use of images in expository texts. How can images enhance the message in expository texts? BRAINSTORM
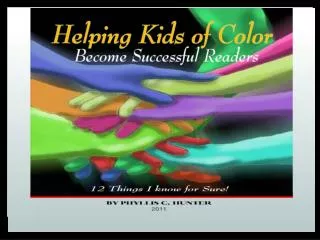
IDENTIFY Examine this image, taken from one of the expository texts we read during Lesson 1. What cultural or social issues are apparent in the image?
EVALUATE Examine this image, taken from one of the expository texts we read during Lesson 1. How does the image add to or detract from the message in the text?
IDENTIFY Examine this image, taken from one of the expository texts we read during Lesson 1. Who is the intended audience?
UNDERSTAND Examine this image, taken from one of the expository texts we read during Lesson 1. How does the audience influence the tone and formality of the image?
BRAINSTORM Examine this image, taken from one of the expository texts we read during Lesson 1. How would the tone and formality of the image be affected if the audience changed?
Content Objective What else am I doing today? I CAN ALSO... synthesize information and draw conclusions based on graphical information within a text.
BRAINSTORM Writers often use graphics such as charts, graphs, and diagrams in procedural texts to clarify ideas. How would using graphics help a reader understand relationships or to make connections between ideas?
chart A graphical representation of data which depicts the relationship between two or more parts of a whole. DEFINE
graph A graphical representation of data which depicts the relationship or intersection between two variables. DEFINE
diagram A plan, sketch, drawing, or outline designed to demonstrate or explain how something works, or to clarify the relationship between the parts of a whole. DEFINE
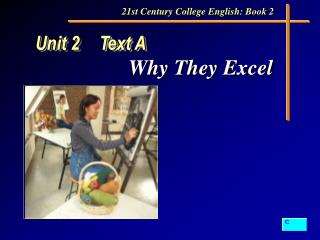
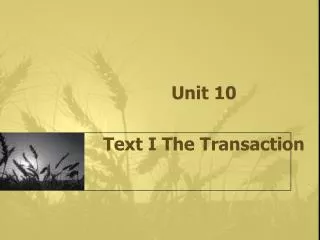
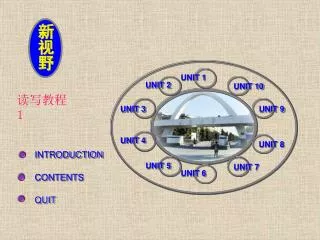
UNDERSTAND Examine this page, taken from one of the expository texts we read during Lesson 1. How does the use of graphics in this selection help to clarify the ideas?
UNDERSTAND Examine this page, taken from one of the expository texts we read during Lesson 1. What connections do they help you make?
EVALUATE When should a writer include graphics in a text?
Content Objective What else am I doing today? I CAN ALSO... evaluate the graphics used in a procedural text. The success or effectiveness of the graphics used in texts depends on several factors, such as: visual appeal; legibility (readability) and clarity; appropriateness; and how they help the reader make connections.
Performance Indicator Now that we understand the criteria that should be used to evaluate the effectiveness of graphics, we need to decide the value of each criterion. As a class, we will create a rubric to evaluate procedural texts for their clarity of graphics and visual appeal. We will then apply this rubric to a group-created procedural text and write a paragraph drawing a conclusion about the ideas presented in the graphics.
EVALUATE Let’s examine the criteria we have discussed, and decide how we wish to value them against each other.
PERCENTAGE RATING (Circle One) Visual Appeal 1 2 3 4 5 Readability 1 2 3 4 5 Appropriateness 1 2 3 4 5 Connection of Ideas 1 2 3 4 5 100% TOTAL EVALUATE Look at the rubric below. How should we weight these variables?
PERCENTAGE RATING (Circle One) Visual Appeal 1 2 3 4 5 Readability 1 2 3 4 5 Appropriateness 1 2 3 4 5 Connection of Ideas 1 2 3 4 5 100% TOTAL EVALUATE Look at the rubric below. What percentage of the whole is each category worth?
PERCENTAGE RATING (Circle One) Visual Appeal Enter % Here 1 2 3 4 5 Readability Enter % Here 1 2 3 4 5 Appropriateness Enter % Here 1 2 3 4 5 Connection of Ideas Enter % Here 1 2 3 4 5 100% TOTAL EVALUATE Here are the percentages that we have agreed upon. Write these values on your own rubric handout.
PERCENTAGE RATING (Circle One) Visual Appeal Enter % Here 1 2 3 4 5 Readability Enter % Here 1 2 3 4 5 Appropriateness Enter % Here 1 2 3 4 5 Connection of Ideas Enter % Here 1 2 3 4 5 100% TOTAL EVALUATE In groups, you will now use these criteria to create a procedural text with graphics.