Understanding Spin Relaxation and Inversion Recovery in MRI Techniques
This comprehensive overview explores key concepts in magnetic resonance imaging (MRI), focusing on spin relaxation processes such as T1 (longitudinal/spin-lattice) and T2 (transverse/spin-spin) relaxation. It details inversion recovery experiments and spin-echo techniques, discussing various time constants (e.g., TE values) and their implications for imaging. The text covers the effects of magnetic field inhomogeneities and describes pulse sequence diagrams essential for understanding magnetization preparation and signal read-out mechanisms. Ideal for students and professionals seeking an in-depth understanding of MRI relaxation phenomena.


Understanding Spin Relaxation and Inversion Recovery in MRI Techniques
E N D
Presentation Transcript
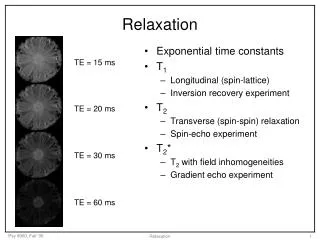
Relaxation • Exponential time constants • T1 • Longitudinal (spin-lattice) • Inversion recovery experiment • T2 • Transverse (spin-spin) relaxation • Spin-echo experiment • T2* • T2 with field inhomogeneities • Gradient echo experiment TE = 15 ms TE = 20 ms TE = 30 ms TE = 60 ms Relaxation
Exponential decay = 30 ms Relaxation
T2 TE = 15 ms TE = 20 ms = T2= 30 ms T2= 50 ms TE = 30 ms TE = 60 ms Relaxation
Exponential recovery Inversion recovery Saturation recovery Relaxation
T1 Inversion recovery T1= 900 ms T1= 1100 ms T1= 2000 ms TI = 50 ms 100 ms 400 ms 800 ms 1600 ms 3200 ms 4800 ms Relaxation
Pulse sequence diagrams Magnetization preparation Excitation Read-out Nrep RF GSS GPE GRO DAC Relaxation
Spin Echo EPI pulse sequence (not to scale) Excitation pulse Refocusing pulse RF GSS … GPE … GRO … DAC Relaxation
Spin Echo measures T2, not T2* Excitation pulse Refocusing pulse Echo Read-out MT T2 T2* S Relaxation
Spin Echo EPI pulse sequence TE/2 TE/2 RF GSS GPE GRO DAC Relaxation
Inversion Recovery Spin Echo EPI TE/2 TE/2 RF GSS GPE GRO DAC Relaxation
Inversion Recovery FLASH NPE RF GSS GPE GRO NRO DAC Relaxation
Spin Echo: erasing magnetic field imperfections Imaging signal comes from protons on water molecules. Frequency map, zoomed in on lateral temporal cortex Hz On resonance Sensitive to macro- and microscopic variations in B0. 100 Hz off resonance 250 Hz off resonance Relaxation
Spin Echo: erasing magnetic field imperfections Summing all spins (e.g. axial slice) creates rapid signal decay Relaxation
Spin Echo: erasing magnetic field imperfections Applying a 180 pulse at TE/2 refocuses the inhomogeneity-induced dephasing at TE t = 0 ms t = TE/2 t = TE Relaxation
SE EPI: reduction of through-slice dephasing Gradient echo Spin echo Relaxation