NMR Relaxation
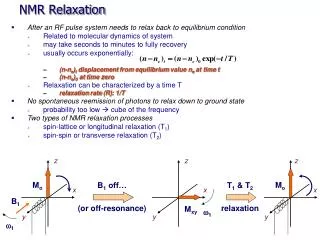
NMR Relaxation. After an RF pulse system needs to relax back to equilibrium condition Related to molecular dynamics of system may take seconds to minutes to fully recovery usually occurs exponentially: (n-n e ) t displacement from equilibrium value n e at time t (n-n e ) 0 at time zero

NMR Relaxation
E N D
Presentation Transcript
NMR Relaxation • After an RF pulse system needs to relax back to equilibrium condition • Related to molecular dynamics of system • may take seconds to minutes to fully recovery • usually occurs exponentially: • (n-ne)t displacement from equilibrium value ne at time t • (n-ne)0 at time zero • Relaxation can be characterized by a time T • relaxation rate (R): 1/T • No spontaneous reemission of photons to relax down to ground state • probability too low cube of the frequency • Two types of NMR relaxation processes • spin-lattice or longitudinal relaxation (T1) • spin-spin or transverse relaxation (T2) z z z Mo Mo B1 off… (or off-resonance) T1 & T2 relaxation x x x B1 Mxy w1 y y y w1
NMR Relaxation • Spin-lattices or longitudinal relaxation • Relaxation process occurs along z-axis • transfer of energy to the lattice or solvent material • coupling of nuclei magnetic field with magnetic fields created by the ensemble of vibrational and rotational motion of the lattice or solvent. • results in a minimal temperature increase in sample • Relaxation time (T1) exponential decay Mz = M0(1-exp(-t/T1))
NMR Relaxation • Spin-lattices or longitudinal relaxation • Relaxation process occurs along z-axis • Measure T1 using inversion recovery experiment
NMR Relaxation • Spin-lattices or longitudinal relaxation • Collect a series of 1D NMR spectra by varying t • Measure T1 using inversion recovery experiment
NMR Relaxation • Spin-lattices or longitudinal relaxation • Collect a series of 1D NMR spectra by varying t • Plot the peak intensities as a function of t fit to an exponential
NMR Relaxation • Mechanism for Spin-lattices or longitudinal relaxation • Dipolar coupling between nuclei and solvent (T1) • interaction between nuclear magnetic dipoles • depends on correlation time • oscillating magnetic field due to Brownian motion • depends on orientation of the whole molecule • in solution, rapid motion averages the dipolar interaction –Brownian motion • in crystals, positions arefixed for single molecule, but vary between molecules leading to range of frequencies and broad lines. Tumbling of Molecule Creates local Oscillating Magnetic field
NMR Relaxation • Mechanism for Spin-lattices or longitudinal relaxation • Solvent creates an ensemble of fluctuating magnetic fields • causes random precession of nuclei dephasing of spins • possibility of energy transfer matching frequency Field Intensity at any frequency • tc represents the maximum frequency • 10-11s = 1011 rad s-1 = 15920 MHz • All lower frequencies are observed
NMR Relaxation • Mechanism for Spin-lattices or longitudinal relaxation • Intensity of fluctuations in magnetic fields due to Brownian motion as a function of frequency • causes random precession of nuclei dephasing of spins • possibility of energy transfer matching frequency tc = 10-8 s-1 Spectral Density Function (J(w)) tc = 10-9 s-1 Increasing MW tc = 10-10 s-1 tc = 10-11 s-1
NMR Relaxation • Spin-lattices or longitudinal relaxation • Relaxation process in the x,y plane • Related to peak line-width • Inhomogeneity of magnet also contributes to peak width • T2 may be equal to T1, or differ by orders of magnitude • T2 can not be longer than T1 • No energy change T2 relaxation (derived from Heisenberg uncertainty principal)
NMR Relaxation • Spin-spin or Transverse relaxation • exchange of energy between excited nucleus and low energy state nucleus • randomization of spins or magnetic moment in x,y-plane • related to NMR peak line-width • relaxation time (T2) Mx = My = M0 exp(-t/T2) Please Note: Line shape is also affected by the magnetic fields homogeneity
NMR Relaxation • Spin-spin or Transverse relaxation • While peak width is related to T2, not an accurate way to measure T2 • Use the Carr-Purcell-Meiboom-Gill (CPMG) experiment to measure “spin-echo” • Refocuses spin diffusions due to magnetic field inhomogeneiety
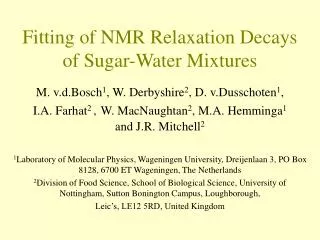
NMR Relaxation • Spin-spin or Transverse relaxation • Collect a series of 1D NMR spectra by varying t • Plot the peak intensities as a function of t and fir to an exponential • Peaks need to be resolved to determine independent T2 values Mx = My = M0 exp(-t/T2) Biochemistry 1981, 20, 3756-3764
NMR Relaxation • Mechanism for Spin-lattices and Spin-Spin relaxation • Relaxation is related to correlation time (tc) • Intensity of fluctuations in magnetic fields due to Brownian motion as a function of frequency • MW radius tc where: r = radius k = Boltzman constant h = viscosity coefficient • rotational correlation time (tc) is the time it takes a molecule to rotate one radian (360o/2p). • the larger the molecule the slower it moves • T2 ≤ T1 • small molecules (fast tc) T2 =T1 • Large molecules (slow tc) T2 < T1
NMR Relaxation • Mechanism for Spin-lattices and Spin-Spin relaxation • Illustration of the Relationship Between MW, tc and T2
NMR Relaxation • Mechanism for Spin-lattices and Spin-Spin relaxation • Relaxation is related to correlation time (tc) • intramolecular dipole-dipole relaxation rate of a nuclei being relaxed by n nuclei Depends on nuclei type Extreme narrowing limit: Depends on distance (bond length)
NMR Relaxation • Mechanism for Spin-lattices and Spin-Spin relaxation • Relaxation is related magnetic field strength (w) T1 minima and values increase with increasing field strength T2 reduced at higher field strength for larger molecules leading to broadening
NMR Relaxation • Mechanism for Spin-lattices and Spin-Spin relaxation • Different relaxation times (pathways) for different nuclei interactions • 1H-1H ≠ 1H-13C ≠ 13C-13C • relaxation rates depend on the number of attached nuclei and bond length • carbon: 13C > 13CH > 13CH2 > 13CH3 • proton: dominated by relaxation with other protons in molecule • Same general trends as intramolecular relaxation Extreme narrowing limit:
NMR Relaxation • Typical Spin-lattices Relaxation Times • T2≤ T1 • Examples of 13C T1 values • number of attached protons greatly affects T1 value • Non-proton bearing carbons have very long T1 values • T1 longer for smaller molecules • Differences in T1 values related to local motion • Faster motion longer T1 • Solvent can affect T1 values Solvent Effects: CH3OH CD3OD
NMR Relaxation • Chemical Shift Anisotropy Relaxation • Remember: • Magnetic shielding (s) depends on orientation of molecule relative to Bo • magnitude of s varies with orientation Bo Solid NMR Spectra • Orientation effect described by the screening tensor: • s11, s22, s33 • If axially symmetric: • s11 = s22 = s|| • s33 = s┴
NMR Relaxation • Chemical Shift Anisotropy (CSA) Relaxation • Effective Fluctuation in Magnetic field strength at the nucleus • Causes relaxation • not very efficient • in extreme narrowing region: • depends strongly on field strength and correlation time • depends strongly on chemical shift ranges • results in line-broadening • increase in sensitivity and resolution at higher field strengths may be overwhelmed by CSA affects
NMR Relaxation • Chemical Shift Anisotropy (CSA) Relaxation • Line-shape increases as CSA increases with magnetic field strength Two peaks in nitrogen doublet experience different CSA contributions Can improve line shape if only select this peak Nature Structural Biology 5, 517 - 522 (1998)
NMR Relaxation • Chemical Shift Anisotropy (CSA) Relaxation • Line-shape increases as CSA increases with magnetic field strength Peaks originating from 195Pt-1H2 couplingare broadened at higher field due to CSA (shortening of T1(Pt) Increasing Magnetic Field
NMR Relaxation • Quadrupolar Relaxation • Quadrupole nuclei (I > ½) • Introduces a second and very efficient relaxation mechanism • a factor of 108 as efficient of dipole-dipole relaxation • Distribution of charge is non-spherical ellipsoidal • for I = ½, charge is spherically distributed • Different charge distribution electric field gradient varies randomly with Brownian motion relaxation mechanism
NMR Relaxation • Quadrupolar Relaxation • Electric Field Gradient (EFG) • tensor quantity • can be reduced to diagonal values Vxx,Vyy,Vzz Vxx + Vyy + Vzz = 0 • asymmetry factor (h): • Vxx,Vyy,Vzz are calculated from the sum of contributions from all charges qi at a distance ri • Quadrupole relaxation times (T1Q,T2Q), where Q is quadrupole moment
NMR Relaxation • Quadrupolar Relaxation • Factors affecting quadrupolar relaxation • Depends strongly on nuclear properties • quadrupole moment (Q) and spin number (I) • Depends strongly on molecular properties • correlation time (tc) • increasing temperature increases tc and increases relaxation time and reduces resonance linewidth • shape (Vzz, h) • Depends primarily on electric field gradient (EFG) • can vary from zero to very large numbers • charge close to nucleus have predominating effect (distance dependence) • movement of molecules in liquid reduces distance effect to zero • solids with fixed distances have contributions from distant charges
NMR Relaxation • Dipole nuclei (I=1/2) coupled to quadrupole nuclei (I>1/2) • Quadrupole relaxation significantly broadens nuclei • obscures spin-splitting pattern • If quadrupole relaxation is slow, broadening is diminished and spin-splitting pattern is observed Very short T1 – average value Increasing T1 Increasing T1 Long T1 normal splitting
NMR Relaxation • Dipole nuclei (I=1/2) coupled to quadrupole nuclei (I>1/2) • Quadrupole relaxation significantly broadens nuclei through scaler coupling • Lowering temperature can sharpen peaks broaden by quadrupole relaxation • lower temperature increase tc shorten T1Q
NMR Relaxation • Quadrupolar Relaxation • If the system is axially symmetric, h =0 and Vxx = Vyy • Only need to determine Vzz • equal distribution of three charges around the z-axis at a distance r from N • Vzz =0 iff=54.7356o – “magic angle” • nuclei at center of a reqular tetrahedron, octahedron or cube have near-zero EFG • long relaxation time is source of structural information
NMR Dynamics and Exchange Despite the Typical Graphical Display of Molecular Structures, Molecules are Highly Flexible and Undergo Multiple Modes Of Motion Over a Range of Time-Frames DSMM - Database of Simulated Molecular Motions http://projects.villa-bosch.de/dbase/dsmm/ Click on image to start dynamics simulation
NMR Dynamics and Exchange • Multiple Signals for Slow Exchange Between Conformational States • Two or more chemical shifts associated with a single atom/nucleus Populations ~ relative stability Rex <w (A) -w (B) Exchange Rate (NMR time-scale) • Factors Affecting Exchange: • Addition of a ligand • Temperature • Solvent
NMR Dynamics and Exchange Different environments OH exchanges between different molecules and environments. Observed chemical shifts and line-shapes results from the average of the different environments. Intermediate exchange: Broad peaks Slow exchange: CH2-OH coupling is observed Fast exchange: Addition of acid CH2-OH coupling is absent
NMR Dynamics and Exchange Effects of Exchange Rates on NMR data k = p Dno2 /2(W1/2)e – (W1/2)o) k = pDno / 21/2 k = p (Dno2 - Dne2)1/2/21/2 k = p ((W1/2)e-(W1/2)o) • k – exchange rate • W1/2 – peak-width at half-height • – peak frequency e – with exchange o – no exchange Dno
NMR Dynamics and Exchange Equal Population of Exchange Sites 40 Hz No exchange: k = 0.1 s-1 slow k = 5 s-1 k = 10 s-1 With exchange: k = 20 s-1 k = 40 s-1 Increasing Exchange Rate coalescence k = 88.8 s-1 k = 200 s-1 k = 400 s-1 k = 800 s-1 k = 10,000 s-1 fast
NMR Dynamics and Exchange • Example of NMR Measurement of Chemical Exchange • Two different cyclopentadienyl groups in [Ti(h1-C5H5)2(h5-C5H5)2] • Exchange rate changes as a function of temperature • But, chemical shifts also change as a function of temperature
NMR Dynamics and Exchange • Example of NMR Measurement of Chemical Exchange • Multiple resonances may be affected by exchange • Rotation about N-C bond • different coalescence rates because of different na-nb C3 & C4 separation smaller than C6 & C2
NMR Dynamics and Exchange • Exchanges Rates and NMR Time Scale • NMR time scale refers to the chemical shift time scale • remember – frequency units are in Hz (sec-1) time scale • exchange rate (k) • differences in chemical shifts between species in exchange indicate the exchange rate. Time ScaleChem. Shift (d)Coupling Const. (J) T2 relaxation Slow k << dA- dB k << JA- JB k << 1/ T2,A- 1/ T2,B Intermediate k = dA - dB k = JA- JB k = 1/ T2,A- 1/ T2,B Fast k >> dA - dB k >> JA- JB k >> 1/ T2,A- 1/ T2,B Range (Sec-1) 0 – 1000 0 –12 1 - 20 2 1 1 Slow exchange at -60o
NMR Dynamics and Exchange • Exchange Rates and NMR Time Scale • NMR time scale refers to the chemical shift time scale • For systems in fast exchange, the observed chemical shift is the average of the individual species chemical shifts. dobs = f1d1 + f2d2 f1 +f2 =1 where: f1, f2 – mole fraction of each species d1,d2 – chemical shift of each species Fast exchange, average of three slow exchange peaks d ≈ 1.86 ppm ≈ 0.25 x 2.00 ppm + 0.25 x 1.95 ppm + 0.5 x 1.75 ppm
NMR Dynamics and Exchange • Unequal Population of Exchange Sites • differential broadening below coalescence • lower populated peak broadens more 40 Hz 3 k = 0.1 s-1 1 slow k = 5 s-1 Exchange rate depends on population (p): k = 10 s-1 k = 20 s-1 k = 40 s-1 Increasing Exchange Rate coalescence Above coalescence: k = 88.8 s-1 k = 200 s-1 k = 400 s-1 k = 800 s-1 fast k = 10,000 s-1 Weighted average
NMR Dynamics and Exchange • Example of NMR Measurement of Chemical Exchange • Unequal populated exchange sites • exchange between axial and equatorial position • exchange rate can be measured easily up to -44oC. Can easily measure na-ne and peak ratios • again, different broadening is related to chemical shift differences between axial and equatorial positions • difficult to determine accurate na-ne • difficult to determine accurate k
NMR Dynamics and Exchange • Use of magnetization transfer to study exchange • Lineshape analysis is related to the rate of leaving each site • no information on the destination • problem for multisite exchange • Saturation Transfer Difference (STD) Experiment • Collect two spectra: • one peak is saturated (decoupler pulse) • decoupler or saturation pulse is set far from any peaks (reference spectrum) • subtract two spectra • If nuclei are exchanging during the saturation pulse, additional NMR peaks will exhibit a decrease in intensity due to the saturation pulse. B A Mz(0) Mz(0) decouple site A MzA = 0 Mz(0) exchange from A to B B A Exchange rate T1 relaxation
NMR Dynamics and Exchange • Use of magnetization transfer to study exchange • at equilibrium (t=∞) • kB can be measured from MZB(∞), MZB(0) and T1B • assumes T1A = T1B • if T1A ≠ T1B,difficult to measure T1A and T1B partial average or
NMR Dynamics and Exchange • Use of magnetization transfer to study exchange • p – t – p/2 pulse sequence • exchange takes place during (t) Saturate peak 2, exchange to peak 3 Saturate peak 1, exchange to peak 4
NMR Dynamics and Exchange • Use of magnetization transfer to study exchange • p – t – p/2 pulse sequence • exchange takes place during (t) Selective 180o pulse Saturation transferred during t Fit peak intensities to determine average T1 and k (k=15.7 s-1 & T1 = 0.835 s)
NMR Dynamics and Exchange • Activation Energies from NMR data • rate constant is related to exchange rate (k=1/tex) Different nuclei and magnetic field strengths Measure rate constants at different temperatures • Calculating DH and DS may not be reliable: • temperature dependent chemical shifts • mis-estimates of line-widths in absence of exchange • poor temperature calibration • signal broadened by unresolved coupling • To obtain reliable DH and DS values: • obtain data over a wide range of temperature where coalescence points can be monitored • measure at different spectrometer frequencies • use different nuclei with different chemical shifts • use line-shape analysis software • use magnetization transfer
NMR Dynamics and Exchange • Two-Dimensional Exchange Experiments • Uses the NOESY pulse sequence (EXSY) • uses a short mixing time (~ 0.05s) • exchange of magnetization occurs during mixing time • NOEs will also be present • need to distinguish between NOE and exchange peaks • usually opposite sign x l Exchange peaks