Download
1 / 42
430 likes | 711 Vues
Energy Needs, Choices and Possibilities Scenarios to 2050. David Frowd Global Business Environment Royal Dutch/Shell Group. Scenario B. Vision. Challenge. Plan. Scenario A. Projects. Scenarios : challenging assumptions and benchmarking vision. Macro-risks. Assumptions.

E N D
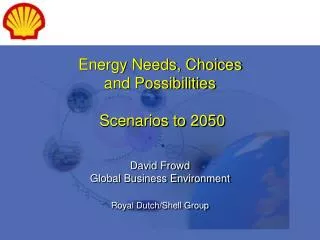
Energy Needs, Choices and Possibilities Scenarios to 2050 David FrowdGlobal Business Environment Royal Dutch/Shell Group
Scenario B Vision Challenge Plan Scenario A Projects Scenarios: challenging assumptions and benchmarking vision Macro-risks Assumptions Shell International Ltd.
What Are Scenarios? • Alternative futures • NOT projections, predictions or preferences • Relevant to business • Challenge assumptions for better strategy Shell International Ltd.
Energy Paths What needs, possibilities and choices will shape an energy system staying below 550 ppmv CO2? We believe we are entering a particularly innovative period for the energy system and that“there is more than one path to a sustainable energy system” Shell International Ltd.
What Shapes Long Term Energy? • The contributors • By 2050 • demography: 8-10 billion people • incomes: average $15-25k/capita • urbanisation: 80% living in cities • liberalisation: markets increase possibilities Shell International Ltd.
US Australia EU Korea Japan China Mexico India Brazil Thailand Climbing The Energy Ladder A Continuously Changing Relationship GJ/capita • +$25k/capita:little extra energy needed. 350 300 • +$15k/capita: • services start to dominate growth. • +$10k/capita:industrialisation near complete. 250 200 150 100 • +$5k/capita:industrialisation and mobility take off. 50 0 0 5 10 15 20 25 30 35 GDP/capita (‘000 1997$ PPP) Shell International Ltd. Source: IMF, BP
What Shapes Long Term Energy? • The contributors • demography • incomes • urbanisation • liberalisation • The critical • resource constraints • technology • social and personal priorities Shell International Ltd.
Oil and Substitute Costs 2000 $ per boe 20 Biofuels competition Gas to Liquids competition 15 10 Unconventional Oil 5 Producedat1.1.2000 0 4000 0 500 1000 1500 2000 2500 3000 3500 billion barrels of oil equivalent Source:Shell, 2000 Shell International Ltd.
The Oil Mountain million bbls per day 125 Ultimate Recoverable Resource 100 2% per annum 3,000 bln bbls + 350 bln bbls of NGLs + 850 bln bbls heavy oil and bitumen excluding shales 75 7.5% per annum 50 25 0 1950 1975 2000 2025 2050 Shell International Ltd. Source: based on USGS mean estimates, June, 2000
The Uncertain Gas Mountain EJ 400 + 13,000 EJ (2200 bln boe) unconventional 300 + 5,000 EJ (1000 bln boe) 3% per annum 200 4% per annum 15,000 EJ (2,600 bln boe) 100 0 1950 1975 2000 2025 2050 Source: based on USGS mean estimates, June 2000 and IPCC 2000 for unconventional Shell International Ltd.
European Gas Production Forecasts bcm Forecast date 300 1998 1994 actual 1993 200 1990 1987 100 1985 1978 0 1970 1980 1990 2000 2010 Shell International Ltd. Source: SIG 1998, EUNG 1978-1994
Renewable Resources are Adequate to Meet all Energy Needs GJ per capita 1000 800 600 Hydro 400 Wind Solar 200 DemandRange Geothermal Biomass 0 FSU Asia Total Africa Middle East & N.Africa Europe N. America S. America Source:adapted from UN 2000, WEC 1994, and ABB 1998. Figures based on 10 billion people. Shell International Ltd.
On-going Renewable Cost Improvements 2000 $ per peak kW 20,000 1981 Photovoltaic systems 10,000 20% 1998 5,000 1982 Windmills 1987 20% 2020 US PV Assoc. 1998 1,000 15% 20% 2008 Wind Assoc. 1963 500 Gas turbines 10% 1980 100 100,000 10 1,000 Cumulative MW installed Shell International Ltd. Source: adapted from IIASA--WEC, 1995
Direct Electricity Solar Fuel Cell Hydrogen Energy Technology Discontinuities 1800 Direct - Wood, Wind, Water, Animals Steam engine - Coal 1830-1900 1850 Electric dynamo - Coal 1900-1940 Internal combustion engine - Oil 1910-1970 1900 Nuclear 1970-1990 CCGT - Gas 1990-? 2000 MANUFACTURING ADVANTAGE 2050 Shell International Ltd.
Dynamics as Usual Energy choices- CitizensEvolutionary system Resource constraints Technologies Social & personal priorities Energy Choices - Consumers Revolutionary developments The Spirit of the Coming Age Energy Branching Points demographics urbanisation incomes & demand liberalisation Innovation and competition Shell International Ltd.
Dynamics as Usual Societal pressures for “secure”, “clean” and “sustainable” energy push a direct path to renewables, supported by gas in the medium term. But only after advances in energy storage and a next generation of renewables around 2025. Vehicle efficiency advances prolong the oil transition. Shell International Ltd.
US Petrol Demand Decoupling from Income Index 1950=100 350 300 GDP per capita 250 200 150 Gasoline sales per capita 100 1950 1970 1990 2010 Source: US EIA, 1999 Shell International Ltd.
Health and Security Concernsin Ageing OECD Societies 2000$/bbl 40 20 Sporadic OPEC cohesionUncertain demand and policies 0 1990 2000 2010 Shell International Ltd.
Changing Automotive Fuels and Technologies % of new cars LPG/CNG 100 Compression ignition engines Diesel (inc GTL and Biomass F-T Fuels) 80 Combined combustion systems 60 Hybrid Gasoline (inc Ethanol) 40 Naphtha/Methanol Spark ignition 20 Hydrogen Fuel cell 0 2000 2010 2020 Shell International Ltd.
Gas-to-Liquids (GTL) based on low temperature Fischer-Tropsch (F-T) cobalt-based synthesis BiomassF-T Fuels Advanced CI/HybridDrive Train F-T GTL Blends F-T GTL 100% Advanced CI/Hybrid Drive Train Renewables Futures Standard CI Drive Train Hydrocarbon powered fuel cell Now F-T GTL 100% Hydrogen Fuel Cell Biomass Hydrogen Solar Hydrogen CI = Compression ignition GTLa bridge to renewable transportation fuels Shell International Ltd.
$/bbl 40 30 20 10 0 1970 1990 2010 2030 Volatile Oil Demand and the Long Oil Game Million bbls per day 125 100 75 50 25 0 1970 1990 2010 2030 2050 Shell International Ltd.
The Next Generation of Coal Power 2015 coal power objectives: - competitive prices - multi-fuel - multi-product liquids - 60% efficiency - pollution free - full CO2 sequestration Shell International Ltd. Source: US DOE, Vision 21, 2001
“Dash for Gas” China, Saudi Arabia, Russia, Iran join WTO Local air quality concerns in Asia Gas and powerliberalisation CO2gas substitution High efficiency CCGT Global Dash For Gas Nuclear and coal decommissioning LNG spot market Middle East budget pressures & export diversification CIShard currency needs Shell International Ltd.
Asian Gas Grid 2020 Sakhalin Yakutsk major demand major supply LNG flows West Baikal Turkmenistan pipelines Ordos Tarim Sichuan Iran Malampaya Oman Natuna Shell International Ltd.
Gas Security Concerns Gas Imports as % of Energy Consumption 25 W. Europe 20 Japan 15 10 North East Asia 5 0 1970 2000 2030 Shell International Ltd.
Liberalisation Disruptions: EU Gas Prices $2000/mmbtu 5 4 3 2 1 0 1990 1995 2000 2005 2010 2015 2020 Shell International Ltd.
A Tale of Two Eras for Renewables Growth and Plateau EJ 75 • intermittence • constraints • saturated OECD demand • planning blockages 50 • strong government support • environment and security • green power niches open 25 0 2000 2010 2020 2030 Shell International Ltd.
Branching Point 2025 Gas? Nuclear? Renewables? 2010 2020 2030 Shell International Ltd.
6 5 Materials and Balance of System 3 fold reduction 4 3 2 Plant 8 fold reduction 1 0 1999 20 MW Plant 300 MW Plant The Benefits of Scale 300 MW PV Factories $ per peak watt Shell International Ltd. Source: from KPMG, 1999 500 MW Plant
Energy Transitions Dynamics as Usual % of Primary Energy 80 Traditional Coal 60 Oil 40 Gas NewRenewables 20 Hydro Biofuels Nuclear 0 1850 1900 1950 2000 2050 Shell International Ltd.
Dynamics as Usual Energy choices- CitizensEvolutionary system Resource constraints Technologies Social & personal priorities Energy Choices - Consumers Revolutionary developments The Spirit of the Coming Age Energy Branching Points demographics urbanisation incomes & demand liberalisation Innovation and competition Shell International Ltd.
Spirit of the Coming Age • Consumer demands for more convenience, flexibility,and independence, supported by advanced hydrocarbon technologies, provide an infrastructure bridge to a hydrogen economy. • Longer term this creates a large demand pull for sustainable hydrogen and renewables. Shell International Ltd.
Infrastructure - The Critical Enabler Percentage of maximum US network size 100 Oil Pipelines Tele- graphs Railways 80 Canals Roads 60 1891 Airways 1835 1946 40 20 Internet 0 1800 1850 1900 1950 2000 Shell International Ltd. Source: IIASA, Grubler & Nakicenovic, 1991
One Size Fits All PEM Fuel Cell $ per kW 100,000 • Vehicles • utilised 50% of time, not 5% • Dwellings • heat & power from fuel cells • power from idle vehicles • Rural Households & Industry • small fuel cell CHP 10,000 1,000 Gas turbine 100 10 1960 1980 2000 2020 Source: Powering the Future, Koppel, 1999 Shell International Ltd.
Rising Coal Logistic Costs in China Trains per day from Shanxi, Henan & Nei Mongol 2500 2000 2500 tonnes and 70 wagons per train 1500 1000 500 0 1970 1980 1990 2000 2010 2020 Source: derived from Investment Strategies for China’s Coal and Electricity Delivery Systems, 1995 IBRD Shell International Ltd.
China Leapfrog 2020 Supply security concerns - oil, gas, fertiliser Air quality concernsand weak regulatory control Large coal resourceLogistic constraints Land scarcity limits bio-fuels China Hydrogen Economy Water scarcityin the north Mass transport & electric drive for uneven terrain Global price for CO2 CH4 and H2 from coal Advanced membranes Fuel cells Shell International Ltd.
The Great Game of GasOil and Gas Demand Million bbls per day 150 100 Gas Oil 50 0 1970 2000 2030 Shell International Ltd.
Primary Energy EJ 1250 New Renewables 1000 Hydro Nuclear 750 Gas 500 Oil 250 Coal CH4 & H2 Coal Traditional 0 1970 1990 2010 2030 2050 Shell International Ltd.
CO2 Emissions and Atmospheric Concentration ppmv billion tonnes carbon 550 14 Spirit of the Coming Age Spirit of the Coming Age 12 500 10 450 8 Dynamics as Usual 6 400 Dynamics as Usual 4 350 2 0 300 2050 1975 2000 2025 2100 1975 2000 2025 2050 2075 Shell International Ltd.
Long Term Energy Scenarios Dynamics as UsualSpirit of the Coming Age “Health and Security” “Convenient and Unobtrusive”Incumbent technologies respond Revolutionary new technologies. Renewables promoted. Convergence around fuel cells. Gas favoured but security concerns. Gas provides backbone Renewables ‘boom then bust’ until Indirect path to sustainable energy new generation and storage Large scale renewables pulled solutions emerge around 2030. by H2 demand post 2030. Towards a renewables dominantTowards a fuel cell dominantelectricity and liquid fuels worldhydrogen economy Shell International Ltd.
Primary Energy Comparison EJ 1250 EJ New Renewables 1000 1000 Hydro Nuclear 750 750 Gas 500 500 Oil 250 250 Coal CH4/H2 Coal Traditional 0 0 1970 1990 2010 2030 2050 1970 1990 2010 2030 2050 Shell International Ltd.
Scenarios - Common Features • Natural gas as a bridge fuel over the next two decades and the importance of mitigating supply security fears. • Strong pressures which oil markets will face as new vehicle technologies diffuse. • Gradual shift towards distributed heat and power for economic and social reasons. • Potential for renewables, particularly solar and biofuels, to dominate primary energy supply in the longer term. Shell International Ltd.