Download
1 / 1
20 likes | 219 Vues
Rice Rotation and Tillage E ffects on Soil Aggregates and T heir Associated Carbon and Nitrogen Contents. J.M . Motschenbacher 1 , K.R. Brye 2 , M.M . Anders 3 , and E.E. Gbur 4

E N D
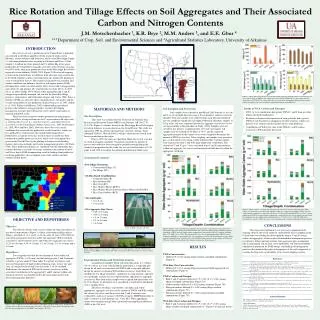
Rice Rotation and Tillage Effects on Soil Aggregates and Their Associated Carbon and Nitrogen Contents J.M. Motschenbacher 1, K.R. Brye2, M.M. Anders 3, and E.E. Gbur 4 1,2,3 Department of Crop, Soil, and Environmental Sciences and 4Agricultural Statistics Laboratory, University of Arkansas INTRODUCTION Rice (Oryza sativa L.) production in the United States is primarily concentrated in the Mississippi River Delta region of south-eastern Missouri, eastern Arkansas and Louisiana, and western Mississippi (Figure 1), with some production also occurring in California and Texas. Of the roughly 1.2 million ha of rice planted and 9.3 million Mg of rice grain produced in the United States annually, over 46% of the total rice area and over 45% of the total grain production occur in the Mississippi River Delta region of eastern Arkansas (NASS, 2009; Figure 2). Rice-based cropping systems in the United States are different from other row crop systems due to the flood-irrigation scheme used from about one month after planting to a few weeks prior to harvest. The frequent cycling between anaerobic and aerobic conditions can influence the rate of soil organic matter (SOM) decomposition, which can subsequently affect water-stable soil aggregation and carbon (C) and nitrogen (N) sequestration over time (Xu et. al, 2007; Six et. al, 2000; Tisdall, 1994). Water-stable aggregation and C and N storage in agriculturally managed soil can also be affected by tillage practices, crop rotation, and fertilization (Angers and Carter, 1996). Since a decline in SOM can adversely affect soil productivity, soil quality, and the overall sustainability of rice production (Salinas-Garcia et. al, 1997; Sollins et al., 1996; Filcheva and Mitova, 2002), understanding agricultural practices that influence soil aggregation is crucial to developing management strategies that will increase soil C and N sequestration at regional and global scales. There have been numerous studies performed investigating the long-term effects of crop rotations on soil C sequestration with crops such as soybean (Glycine max L.), corn (Zea mays L.), and wheat (TriticumaestivumL.) in the United States(Salinas-Garcia et al., 1997; Halvorson et al., 2002; West and Post, 2002). However, due to the cyclic anoxic conditions that occur with rice production, results from these studies are less applicable to crop rotations that include flood-irrigated rice. Furthermore, a majority of the rice research that is available has been conducted on paddy-grown rice in Asia, which varies from upland rice grown in the United States by the planting techniques used, flooding regimes, harvesting methods, and residue management practices (De Datta, 1981). These production differences, combined with the information that climatic differences accounts for a large variation in the amount of soil C and N loss due to SOM decomposition, result in findings from paddy rice not being applicable to the geographic area of the southern and mid-southern United States. Figure 1. Rice production area in the Mississippi Delta region of the United States of America. Figure 7. Tillage and soil depth effects on total water-stable aggregate (TWSA) carbon (C) and nitrogen (N) (A); rotation effects on TWSA C (B); tillage and rotation effects on TWSA N (C); and rotation and soil depth effects on TWSA N (D) contents after 10 years of consistent management. Different letters on bars within each graph for the same variable are significantly different at the 0.05 level. • Trends in WSA Carbon and Nitrogen • NT/0- to 5-cm combination had greater TWSA C and N than any other tillage-soil depth combination • Rotations with increased frequencies of corn generally had a greater TWSA C and N content in comparison to other rotations, whereas no patterns were evident with the number of rice crops produced • Contributions of WSA-size class to the TWSA C and N content increased as WSA diameter decreased MATERIALS AND METHODS Site Description This study was conducted at the University of Arkansas’ Rice Research and Extension Center (RREC) near Stuttgart, AR (34o27' N, 91o24' W; Figure 4), which is located in the Mississippi River Delta region of eastern Arkansas in an area known as the Grand Prairie. This study was initiated in 1999 on a Dewitt silt loam [fine, smectitic, thermic, TypicAlbaqualf (USDA); Gleysol (FAO)], which is characteristic of soils used for rice production in the region. Prior to 1999, the study area had been fallow for several years due to a lack of irrigation capability. Vegetation consisted of a mixture of grasses and weeds that were managed by periodic mowing during the summer. In preparation for this study, the site was land-leveled to a 0.15% grade in fall 1998 to facilitate the uniform distribution of flood water. • Soil Sampling and Processing • Soil samples were collected in mid-March 2009 from the 0- to 5-cm and 5- to 10-cm depth intervals using a 10-cm diameter, stainless steel core chamber. Two core samples were collected from each plot and combined into one composite sample for each depth. Following collection, samples of 150 g of dry soil were separated into the five aggregate-size classes by wet sieving according to the procedure of Yoder (1936). Samples were wet-sieved for five minutes at approximately 130 cycles per minute. All samples were oven-dried for 24 hours at 70o C, and the separated aggregates retained on the various sieves were weighed to determine the amount of WSA by size class. After weighing, soil samples were ground to pass a 2-mm mesh screen using aroller-mill procedure. Ground samples were analyzed for total C and N by high-temperature combustion. The contents of C and N (g m-2) were calculated from C and N concentrations within soil aggregate-size classes and measured soil bulk density within the appropriate soil depth. • Treatments Evaluated • Two Tillage Treatments • Conventional Tillage (T) • No-Tillage (NT) • Six Rice-Based Crop Rotations • Continuous Rice (R) • Rice-Soybean (RS) • Rice-Corn (RC) • Rice (Winter Wheat) [R(W)] • Rice (Winter Wheat)-Soybean (Winter Wheat) [R(W)S(W)] • Rice-Corn-Soybean (RCS) • Two Soil Depths • 0- to 5-cm • 5- to 10-cm • Five Aggregate-Size Classes • 0.25- to 0.5-mm • 0.50- to 1.0-mm • 1.0- to 2.0-mm • 2.0- to 4.0-mm • > 4.0-mm > 30350 ha 20235 to 30350 ha 10120 to 20235 ha 2025 to 10120 ha < 2025 ha Figure 8. Tillage, rotation, soil depth, and aggregate-size class effects on water-stable aggregate (WSA) carbon (C) content. The total water-stable aggregate (TWSA) C content for each tillage, rotation, and soil depth treatment combination is represented by the top of each bar. The individual WSA-size class C contents making up the TWSA for each treatment combination is represented by the colored segment associated with the designated size class within each bar (Standard Error = 5.7; LSD = 11.9 to 16.0). The LSD values presented for C content of WSA-size classes vary depending on the treatment combinations being compared. Figure 2. Arkansas 2006 rice production divided by county, University of Arkansas, 2009 OBJECTIVE AND HYPOTHESES Objective The objective of this study was to evaluate the long-term effects of rice-based crop rotations (Figure 3), tillage (conventional tillage and no-tillage), soil depth (0- to 5- and 5- to 10-cm) after 10 years (1999-2009) of consistent management on water-stable soil aggregates (WSA) and their associated C and N contents across and within five aggregate-size classes (0.25- to 0.50-mm, 0.50- to 1.0-mm, 1.0- to 2.0-mm, 2.0- to 4.0-mm, and > 4.0-mm). Hypotheses It was hypothesized that the total amount of water-stable soil aggregates (TWSA; > 0.25-mm) and the total aggregate C and N contents would be i) greater under NT than under T ii) greater in rotations with increased frequencies of high residue producing crops, such as rice and corn, iii) and greater in the top 5 cm than in the 5- to 10-cm depth. Furthermore, the amount of WSA in the various size classes and the associated contribution to the aggregated C and N contents within each treatment structure was hypothesized to be increasingly greater with decreasing aggregate diameters. CONCLUSIONS This long-term experiment was a necessary component in the ongoing effort to effectively study the sustainability of rice cropping in the United States by enabling the direct quantification of C and N storage within soil aggregates, which resulted from modified management practices in relation to tillage and crop rotation. Soil aggregates play an important role in maintaining soil aeration, water infiltration, soil structural stability, and physical protection for SOM storage, and finding soil management practices that maintain these physical properties of the soil is important in assuring the long-term sustainability of rice-based cropping systems. Figure 4. RREC, Stuttgart, AR, USA Figure 6. Tillage, rotation, soil depth, and aggregate-size class effects on the amount of soil composed of water-stable aggregates (WSA) greater than 0.25-mm. The total water-stable aggregate (TWSA) weights for each tillage, rotation, and soil depth treatment combination is represented by the top of each bar (Standard Error = 7.9; LSD = 18.8 to 23.0). The individual WSA-size class weights making up the TWSA for each treatment combination is represented by the colored segment associated with the designated size class within each bar (Standard Error = 2.4; LSD = 5.5 to 6.9). The LSD values presented for the weights of TWSA and WSA-size classes vary depending on the treatment combinations being compared. • RESULTS • TWSA Concentration • Differed (P = 0.02) among tillage-rotation-soil depth combinations (Figure 6) • WSA-Size Class Concentration • Differed (P< 0.01) among tillage-rotation-soil depth-aggregated size combinations (Figure 6) • TWSA Carbon and Nitrogen • Both C and N contents differed (C, P < 0.01; N, P< 0.01) among tillage-soil depth combinations (Figure 7A) • Carbon contents differed (P= 0.02) among rotations (Figure 7B) • Nitrogen contents differed (P= 0.02) among tillage-rotation combinations (Figure 7C) • Nitrogen contents differed (P= 0.04) among rotation-soil depth combinations (Figure 7D) • WSA-Size Class Carbon and Nitrogen • Both C and N contents differed (C, P < 0.01;N, P< 0.01) among tillage-rotation-soil depth combinations (C, Figure 8; N, data not shown) Figure 5. Representation of the field sites sampled for water-stable aggregates at the Rice Research and Extension Center (RREC) near Stuttgart, AR, USA. Crops grown in the fields include rice, wheat, soybean, and corn. • Experimental Design and Statistical Analyses • A randomized complete block with four replications (i.e., blocks) (76- by 120-m) was used, with the blocks partitioned as a strip-split plot design for all analyses associated with TWSA and a strip-split-split plot design for analyses evaluating WSA within size classes. Each block was divided into two tillage treatments, striped into six crop rotations, split into two soil depths, and for size class differentiation, split into five aggregate-size classes. Plots from which samples were acquired had dimensions of 6- by 19-m (Figure 5). All factors were considered as fixed effects and blocks were a random effect. • The effects of tillage, crop rotation, soil depth, and, where appropriate, aggregate-size class on the amount of TWSA and WSA within the various size classes and their associated C and N contents were evaluated by analysis of variance (AVOVA) using the MIXED procedure in SAS® (version 9.2, SAS Institute, Inc., Cary, NC). When appropriate, means were separated using Fisher’s protected least significant difference (LSD) at the 0.05 level. • References • Angers, D.A., and M.R. Carter. 1996. Aggregation and organic matter storage in cool, humid agricultural soils. pp. 193-211. In M.R. Carter and • B.A. Stewart. Structure and organic matter storage in agricultural soils. CRC Press, Baton Raton, FL. • De Datta, S. K. 1981. Principles and practices of rice production. John Wiley & Sons, New York, NY. • Filcheva, E., and T. Mitova. 2002. Effect of crop rotation and the composition of soil organic matter. pp. 237-263. In J.M. Kimble, R. Lal, and • R.F. Follett. (eds.) Agricultural practices and policies for carbon sequestration in soil. CRC Press, Boca Raton, FL. • Halvorson, A.D., B.J. Wienhold, and A.L. Black. 2002. Tillage, nitrogen, and cropping system effects on soil carbon sequestration. Soil Sci. Soc. • Am. J. 66:906-912. • National Agricultural Statistics Service (NASS). 2009. U.S. & all states data – crops: Planted, harvested, yield, production, price (MYA), value • of production [online]. Available at http://nass.usda.gov/QuickStats/PullData_US.jsp (verified 16 September, 2009). • Salinas-Garcia, J.R., F.M. Hons, and J.E. Matocha. 1997. Long-term effects of tillage and fertilization in soil organic matter dynamics. Soil Sci. • Soc. Am. J. 61:152-159. • Six, J., E.T. Elliott, and K. Paustain. 2000. Soil microaggregate formation: a mechanism for C sequestration under no-tillage agriculture. Soil • Biol. Biochem. 32:2099-2103. • Sollins, P., P. Homann, and B.A. Caldwell. 1996. Stabilization and destabilization of soil organic matter: Mechanisms and controls. Geoderma • 74:65-105. • Tisdall, J.M. 1994. Possible role of soil microorganisms in aggregation in soils. Plant Soil 159:115-121. • West, T.O., and W.M. Post. 2002. Soil organic carbon sequestration rates by tillage and crop rotation: A global data analysis. Soil Sci. Soc. Am. • J. 66:1930-1976. • Xu, Y., W. Chen, and Q. Shen. 2007. Soil organic carbon and nitrogen pools impacted by long-term tillage and fertilization practices. Comm. • Soil Sci. Plant Anal. 38:347-357. • Yoder, R.E. 1936. A direct method of aggregate analysis of soils and a study of the physical nature of erosion losses. J. Am. Soc. Agron. 28:337- • 351. Acknowledgments This research was partially funded by the Arkansas Rice Research and Promotion Board. Field assistance provided by Terry Sells and Daniel McCarty is gratefully acknowledged. Contact Information: 1Jill M. Motschenbacher, Graduate Research Assistant, Soil Physics, Department of Crop, Soil, and Environmental Sciences, University of Arkansas, 115 Plant Sciences Bldg., Fayetteville, AR, 72701, USA. Office: +1(479) 575-3590; Email: jmotsche@uark.edu Figure 3. Crops commonly used in rotation with rice in the Mississippi River Delta region include wheat, soybean, and corn. Rotation treatments were analyzed for differences in water-stable soil aggregates at the Rice Research and Extension Center (RREC) near Stuttgart, AR, USA.


![[ t-t-t ]](https://cdn1.slideserve.com/3099327/slide1-dt.jpg)