Download
1 / 24
240 likes | 359 Vues
Metabolic Constraints on Marine Habitat and its Climatic Changes. Curtis Deutsch University of California, Los Angeles. In collaboration with: Aaron Ferrel, Taka Ito, Hartmut Frenzel. And funded by:. 2) Microbes (biogeochemistry). 1) Macrofauna (ecology). 1.0.

E N D
Metabolic Constraints on Marine Habitat and its Climatic Changes Curtis Deutsch University of California, Los Angeles In collaboration with: Aaron Ferrel, Taka Ito, Hartmut Frenzel And funded by:
2) Microbes (biogeochemistry) 1) Macrofauna (ecology) 1.0 Onset of denitrification O2~ 5 mM “Suboxia” 0.8 Oxygen and marine ecosystems 0.6 NO2 (mmol/liter) Fraction Species Habitability 0.4 50% lethality O2~ 50 mM “Hypoxia” 0.2 0 0 2 4 6 8 10 12 14 16 18 0 60 120 180 240 300 O2 (mM) O2 (mM) Vacquer-Sunyer and Duarte [2008] Devol [1978] Low O2restricts habitat of aerobic macrofauna. - anaerobic metabolism - mortality Low O2creates habitat for anaerobic microbes. - denitrification, annamox - widespread N limitation
Biogeochemical Changes Simulations (GCM) Observations (CalCOFI) O2 cycle N cycle Deutsch et al. [2011]
Hypoxic sensitivity The sensitivity of hypoxic volumes can be predicted from data alone. It increases rapidly with decreasing O2 threshold. Model simulations (dots) consistent with this simple prediction. Change in volume (predicted) Global O2 anomaly (assumed) Derivative of histogram (observed) Normalized change in hypoxic volume (DVO2/VO2) 300% log(DVO2/VO2) 100% DO2 30% 10% Deutsch et al. [2011]
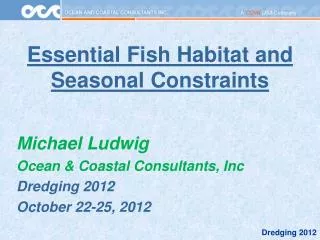
Goals of this Study Question: How does climate warming change the aerobic habitat of marine species? Strategy: Integrate laboratory, demographic, and climate data to map the metabolic scope of diverse marine species across their geographic range.
A General Framework Gas Transfer Metabolic Rate Alternate interpretation: F is the ratio of potential metabolic rate to minimum rate for survival, i.e. a non-dimensional measure of metabolic scope [Fry, 1947; Hochachka, 1990]. Problem: Index depends (invisibly) on many physiological factors. Solution: Estimate coefficients (Eo, Ao) using laboratory data. Ferrel and Deutsch [in review]
Laboratory data • Use published laboratory experiments on hypoxic tolerance (O2crit) measured as onset of anaerobic metabolism and increased mortality (LC50) • (O2crit) = 1 • Estimate parameters • Ao (intercept) • Eo (slope) • Mass and temperature account for ~70% of variance. Problem: Laboratory tanks are not the real world! Solution: Map F alongside species distribution data. Ferrel and Deutsch [in review]
Distribution data: Cod F =1.6 Cod Characteristics: Depth of habitat 0-400m Mass at maturity 500-1500g Range of Fcrit 1.3-2.6 Distribution data from Fishbase.org
Seasonal Migration Eastern Population Migrates Surface in spring/winter To ~250 m in summer/fall Western Population Migrates From ~37oN in winter To ~41oN in summer F =1.6
Fmax=2.4 Fmin=2.4 Seasonal populations Annual populations Species Distribution: Rock Crab Crab Characteristics: Depth of habitat 0-400m (benthic) Mass (larval) 1.25-5 x10⁻⁴ Range of Fcrit 1.8-4.1 Annual Populations
Species Distribution: Seabream F =2.2 Seabream Characteristics: Depth of habitat 0-60m Mass at maturity 300-900g Range of Fcrit 1.6-4.0 Distribution data digitized from Andriashev 1986 and Van Neer 1997
Species Distribution: Eelpout Eelpout Characteristics: Depth of habitat 0-40m Mass at maturity 100-300g Range of Fcrit 1.4-3.3 F =1.9 Distribution data digitized from Svetodvidov 1986
Comparison to Terrestrial Taxa Ratio of Field to Resting Metabolic Rates: Birds, mammals, lizards 1.5-5 (max 7) Marine fish/crabs 1.3-4.1 (1.6-2.4) Humans 1.4-5.6 Peterson, Nagy, Diamond [1990]
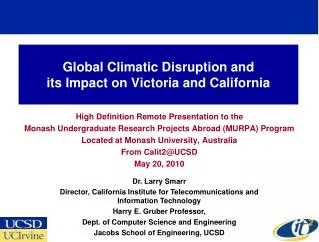
Climate Projections Projected T, O2 changes in 2071-2100, 0-400m IPCC Earth System Model mean, RCP8.5 scenario B A DT (oC) DO2 (mM) Warming is global, deoxygenation is extra-tropical.
Projected change in F in 2071-2100, 0-400m IPCC Earth System Model mean, RCP8.5 scenario Declining Metabolic Index Global mean Decrease ~20% Northern High Latitudes ~40%
Temperature vs Oxygen Oxygen contribution Temperature contribution B A DFO2 (%) DFT (%) Globally, warming and deoxygenation contribute ~15% and 5% reduction of metabolic index, respectively. The role of O2 is greater in the Pacific, where O2 is already lower.
Metabolic Habitat Loss Relative change in habitable thickness (%) Habitat Loss Cod -24% Rock Crab -22% Habitat Loss (slope, annual) Seabream -14% Eelpout -26%
Integrated Habitat Loss Loss of metabolic habitat is generally greater than the loss of thermal habitat (Tmax), but not always. The loss of O2 contributes ~25% of the metabolic habitat loss. Its role in the Pacific is likely to be even greater.
Conclusions • The ratio of O2 supply to demand - an index of metabolic scope – can be mapped using laboratory, demographic, and climate data. • Species with diverse thermal and hypoxic tolerances are limited at the equatorward edge of their geographic range by a similar metabolic scope, consistent with that of terrestrial taxa. • Metabolic habitat is projected to contract rapidly due to the synergistic impacts of anthropogenic warming (~75%) and the associated loss of oxygen (~25%).
Figure S5 A B C
A B