Download

1 / 29
290 likes | 315 Vues
Learn about the basics of kriging and regression, and how they can be combined to make better predictions. Explore Empirical Bayesian Kriging (EBK) and Regression Kriging techniques. Discover the new EBK Regression Prediction tool in ArcGIS Pro 1.2.

E N D
Getting Improved Predictions Using Kriging and Regression Eric Krause
Outline • Introduction • Basics of kriging and interpolation • Empirical Bayesian Kriging • Regression Analysis Basics • Regression Kriging • EBK Regression Prediction – New tool in ArcGIS Pro 1.2 • Questions
What is interpolation? • Predict values at unknown locations using values at measured locations • Assumes spatial autocorrelation • Many interpolation methods, both statistical and non-statistical
Why are geostatistical methods important? • Non-statistical interpolation methods • Not based in statistical theory • Not able to estimate prediction error, unclear assumptions • Examples: IDW, Spline, Natural Neighbor, Trend • Geostatistical methods • Predictions based on statistical principles and theory • Clear assumptions that can be checked • Provide measures of uncertainty for predictions
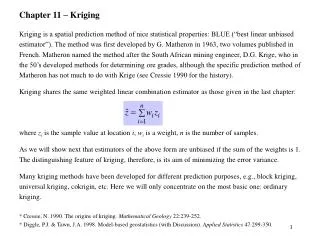
Introduction to kriging • Most widely used geostatistical method • Optimal under certain conditions • Many types of kriging: ordinary, simple, universal, indicator, disjunctive, etc • Simple kriging model: • Prediction = (Average Value) + Error • Average Value is constant and Error term estimated from surrounding points
Semivariogram • Quantifies the first law of geography • Composed of nugget, range, and sill
Kriging assumptions • When is kriging optimal? • Assumptions • Normally distributed data • Stationary • No trends
Kriging output surface types Prediction Error of Predictions Probability Quantile
Validating kriging models • Crossvalidation – leave-one-out method • Root- Mean-Square Error – as small as possible • Mean Error and Mean Standardized Error – close to zero • Root-Mean-Square Standardized Error – close to one • Average Standard Error – as small as possible, close to RMSE • Validation • Split data into training and validation set • Create model with training set, predict to validation set • Same statistics as crossvalidation
Demo ESDA and Kriging Eric Krause Eric Krause, Konstantin Krivoruchko
Empirical Bayesian Kriging • Advantages • Requires minimal interactive modeling, spatial relationships are modeled automatically • Usually more accurate, especially for small or nonstationary datasets • Uses local models to capture small scale effects • Doesn’t assume one model fits the entire data • Standard errors of prediction are more accurate than other kriging methods • Disadvantages • Processing is slower than other kriging methods • Limited customization
How does EBK work? • Divide the data into subsets of a given size • Controlled by “Subset Size” parameter • Subsets can overlap, controlled by “Overlap Factor” • For each subset, estimate the semivariogram • Simulate data at input point locations and estimate new semivariogram from the simulated data • Repeat step 3 many times. This results in a distribution of semivariograms • Controlled by “Number of Simulations” • Mix the local surfaces together to get the final surface.
Data in Geographic Coordinate Systems • Euclidean distance for geographic coordinates is very inaccurate, particularly far from the equator • In ArcGIS 10.3, EBK uses chordal distances • Chordal distance is the 3D straight-line distance between points on a spheroid • Accurate approximation to geodesic distance up to 30 degrees
Demo Empirical Bayesian Kriging Eric Krause Eric Krause, Konstantin Krivoruchko
Regression analysis basics • Ordinary Least Squares is one of the widest used statistical techniques • Dependent variable is modeled as a weighted sum of explanatory variables • Explanatory variables should have linear relationship with dependent variable • Explanatory variables should be independent • Ordinary Least Squares model: • Dependent variable = Intercept + (EV1 * coef1) + (EV2 * coef2) + … + (EVk * coefk) + Error • Error is assumed to be random noise, coefficients estimated by regression equation • OLS and Geographically Weighted Regression available in Spatial Statistics toolbox
Regression kriging basics • Hybrid of regression and kriging • Regression kriging model: • Dependent variable = Intercept + (EV1 * coef1) + (EV2 * coef2) + … + (EVk * coefk) + Error • Error is modeled with a semivariogram • Regression equation estimates the average value for kriging. • Kriging performed on error term • Ordinary Least Squares and Simple Kriging are special cases • More direct and useful than cokriging
EBK Regression Prediction – New in ArcGIS Pro 1.2 • Performs regression kriging through EBK framework • Unifies kriging, EBK, and regression • Uses explanatory variables to improve predictions • Automatically extracts useful information, filters noise • Regression models and semivariograms estimated locally with simulations • Maintains advantages of EBK – local effects, accurate standard errors, automatic modeling • Explanatory variables are transformed into principle components prior to modeling • Solves problem of correlated explanatory variables • Ensures stability without loss of accuracy • All parameters estimated simultaneously in each simulation
EBK Regression Prediction – Example applications • Interpolating rainfall or temperature using elevation • Housing prices using house attributes • Pollution using population density • Precision agriculture using soil properties, environmental conditions
EBK Regression Prediction – Workflow • Choose dependent variable and explanatory variables • Optionally, verify that each explanatory variable has linear relationship with dependent variable • Decide on EBK Regression Kriging parameters • Transformations, subsets, semivariogram model, etc • Use EBK Regression Prediction tool to create candidate model, output geostatistical layer • Check diagnostics, decide if candidate model is acceptable • May need to repeat above steps for several candidates • Export model to rasters for mapping and decision making • GA Layer to Rasters gp tool. New in Pro 1.2.
EBK Regression Prediction – Input datasets • Dependent variable supplied as points • Explanatory variables must be supplied as rasters • Values of explanatory variable rasters are extracted to each input point
EBK Regression Prediction – Parameters and Options • Contains all parameters in EBK • Transformation options – Empirical and Log Empirical • Subset control – size, overlap • In ArcGIS Pro 1.3, provide your own subsets • Semivariogram models and number of simulations • Control over principle components • Minimum cumulative percent of variance
EBK Regression Prediction – Diagnostics • Three levels of diagnostics • Local: • Point-level crossvalidation statistics • Regional: • Statistics at subset level • Global • Crossvalidation summary statistics
Demo EBK Regression Prediction Eric Krause Eric Krause, Konstantin Krivoruchko
Looking forward… • EBK Explanatory Regression • The other half of regression analysis • Explains the relationships between explanatory variables and dependent variable • Adds many usability complications, needs custom solution • Geostatistical Wizard in ArcGIS Pro • Will include EBK Regression Prediction and any upcoming tools
Please take our Survey Your feedback allows us to help maintain high standards and to help presenters Find your event in the Esri Events App Find the session you want to review Scroll down to the bottom of the session Answer survey questions and submit