Download
1 / 66
660 likes | 863 Vues
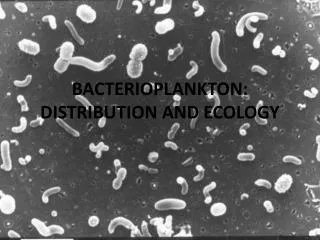
Origins of diversity in the bacterioplankton. Theory, observations and evolutionary experiments 7/24/07. Lecture Outline. Diversity - Classification and observing Generation - vertical and horizontal mechanisms Persistence - Neutral Theory Niche Theory

E N D
Origins of diversity in the bacterioplankton Theory, observations and evolutionary experiments 7/24/07
Lecture Outline • Diversity - • Classification and observing • Generation - • vertical and horizontal mechanisms • Persistence - • Neutral Theory • Niche Theory • Ecological trends in pelagic systems
BIODIVERSITY A Marine Assemblage Fluorescent microscopy Macro Micro Diversity: Classification and observing
Kingdom Animalia Bacteria Archaea Genetic diversity Pace, 1997 Eucarya Nucleic Acids Diversity: Classification and observing
Ribosomal RNA -ubiquitous -conserved function -conserved+variable sequence fixed variable Image credit: NIH inside the cell Areas in red and grey may vary in this molecule, and areas in violet and blue may not.
Bacteria Archaea Eucarya Quantitatively inferring relationships “Alignment” of 16S/18S rRNA VARIABLE Homo sapiens ...GTGCCAGCAGCCGCGGTAATTCCAGCTCCAATAGCGTATATTAAAGTTGCTGCAGTTAAAAAG... S. cereviceae ...GTGCCAGCAGCCGCGGTAATTCCAGCTCCAATAGCGTATATTAAAGTTGTTGCAGTTAAAAAG... Zea maize ...GTGCCAGCAGCCGCGGTAATTCCAGCTCCAATAGCGTATATTTAAGTTGTTGCAGTTAAAAAG... Escherichia coli ...GTGCCAGCAGCCGCGGTAATACGGAGGGTGCAAGCGTTAATCGGAATTACTGGGCGTAAAGCG... Anacystis nidulans ...GTGCCAGCAGCCGCGGTAATACGGGAGAGGCAAGCGTTATCCGGAATTATTGGGCGTAAAGCG... Thermotoga maritima ...GTGCCAGCAGCCGCGGTAATACGTAGGGGGCAAGCGTTACCCGGATTTACTGGGCGTAAAGGG... Methanococcus vannielii ...GTGCCAGCAGCCGCGGTAATACCGACGGCCCGAGTGGTAGCCACTCTTATTGGGCCTAAAGCG... Thermococcus celer ...GTGGCAGCCGCCGCGGTAATACCGGCGGCCCGAGTGGTGGCCGCTATTATTGGGCCTAAAGCG... Sulfolobus sulfotaricus ...GTGTCAGCCGCCGCGGTAATACCAGCTCCGCGAGTGGTCGGGGTGATTACTGGGCCTAAAGCG... Diversity: Classification and observing
2004 - 80 divisions 26/54 “Domain” Bacteria 1994 - 13 divisions (all cultured) BACTERIAL “PHYLA/CLASS” ~80-90% rRNA SIMILARITY Diversity: Classification and observing
RDP Global Census, 2003 FIG. 3. Collector's curve of the Chao1 nonparametric richness estimator for sequences in the RDP-II. Accession numbers were used to determine the order in which sequences have been sampled. OTUs defined by a collection of identical sequences reached an estimate of 325,040 different OTUs. Schloss and Handlesman, 2004 Diversity: Classification and observing
Strategy for exploring genetic diversity (Culture-independent) environment PCR amplified rRNA genes identification and removal of artifacts clone, sequence and analyze • Chao-1 non-parametric richness estimator S = Sobs + (a2/2b) Sobs total # observed species a species observed once b species observed twice estimates of diversity Diversity: Classification and observing
Estimating diversity in microbial ecology Extrapolated diversity of a sampled abundance • Depend on several factors: • Underlying distribution • Sample size • Sampling strategy Diversity: Classification and observing
Two types of estimators for diversity • Non-parametric estimators (Chao and lee, 1992) • No abundance distribution model is assumed • predict minimum number expected-> not total diversity! • Chao-1 • ACE (abundance-based coverage estimator of species richness) estimates the diversity of rare and abundant taxa separately • Parametric estimators (see discussion in Hong, PNAS, 2006) • The abundance distribution is assumed to have a specific form • Observed distribution is fit by maximum likelihood model • Power-law • Lognormal • Pareto • Gamma • Large potential for error as we really don’t understand the natural distributions of biodiversity! Diversity: Classification and observing
How many types coexist in marine microbial communities? - wide variation in estimates Diversity: Classification and observing
Why such variabilities in distribution? Rare Biosphere ~25% ~25% • Most diversity is rare • New approach: Tag-sequencing 16S allows high-sample number = 118,000 PCR amplicons ~120 bp hyper-variable region of 16S rRNA • Non-parametric (chao1 and ACE) estimation of diversity at eight oceanic sites - meso- and bathypelagic realms combined predict ~104 coexisting types per site (10-fold higher than other marine estimates) • Relative abundance of OTUs varies 1000-fold. Most of diversity is low-abundance populations Sogin, PNAS 2006 Diversity: Classification and observing
Q: How is relatedness of 16S rRNA correlated to genomic similarity? Sediment actinobacteria Stackebrandt and Goebel, 1994 70% DNA-DNA re-association has been the “gold standard” for assigning culture-positive organisms to microbial species. - correlates to 97-100% rRNA identity. The reciprocal relationship does not hold. A: Not that well… Diversity: Classification and observing
How are bacterial genomes differentiated? e.g. three E. coli strains have in common <40% of total protein genes • Core genome: • shared by all • (e.g., housekeeping) • Flexible genome: • strain specific • (e.g., pathogenicity islands, antibiotic resistance, integrons) Welch et al. (2002) • strains from different environments Diversity: Classification and observing
Size variation among bacterioplanktonic “V. splendidus” genomes Isolates paired by identical Hsp60 alleles and represent spectrum of observed diversity Genome sizes (4.5 to 5.6 Mb) phylogenetic relationships of Hsp60 alleles Suggests some diversification is due to large-scale genome changes Diversity: Classification and observing
What drives genome diversification? GENOME Elements Out Elements In Duplication Horizontal gene transfer -homologous recombination -non-homologous recombination • Gene Loss Dynamic genome content Diversity: Generation
Mechanisms of Lateral Diversification Foreign DNA uptake: Conjugation Transformation Transduction Conjugation: A bacterium attaches to another bacterium and passes a fragment of its DNA (chromosomal or plasmid) to the recipient cell. It is not known how many environmental bacterial exchange DNA through conjugation. (CAMERA query): What is the ratio of genes encoding sex pili to recA? Diversity: Generation
WH Freeman Mechanisms of Lateral Diversification Foreign DNA uptake: Conjugation Transformation Transduction Transformation: Fragments of bacterial DNA are taken up by a cell from the environment. These genetic fragments may recombine with the host chromosome, permanently adding new genes. Diversity: Generation
Mechanisms of Lateral Diversification Foreign DNA uptake: Conjugation Transformation Transduction WH Freeman Transduction: Phage carry bacterial DNA from one bacterium to another Diversity: Generation
What happens after DNA uptake? Destruction Plasmid replication Homologous Recombination Site-specific Recombination Non-homologous Recombination Diversity: Generation
What happens after DNA uptake? Destruction Plasmid replication Homologous Recombination Site-specific Recombination Foreign DNA recognized by foreign methylation patterns Restriction endonucleases cleave foreign DNA G A * * * ATTGCCCGTAATATTACG TAACGGGCATTATAATGC A A C T G G T A C T T C Diversity: Generation
DNA as Food? [DNA]marine >100ug/L [DNA]sediment >100ug/g FIG. 3. Average growth yields of wild-type (WT) or com mutant cells in minimal medium supplemented with 0.1% ultrapure sonicated salmon sperm DNA as the sole source of carbon and energy. Growth yields (indicated above each bar) were determined by dividing the number of cells after 24 h of incubation by the number of cells at inoculation. DNA uptake mutants Palchevskiy and Finkel, J. Bac, 2006 Wild-type E. coli Diversity: Generation
Mechanisms of Lateral Diversification Destruction Plasmid replication Homologous Recombination Site-specific Recombination WH Freeman Diversity: Generation
What happens after DNA uptake? Destruction Plasmid replication Homologous Recombination Site-specific Recombination WH Freeman Diversity: Generation
Ratio: recombination to mutation Identify recombination events as deviations from phylogenetic congruency 12 strains of E. coli (method of Wilson et al 1977) Guttman and Dykhuizen, Science 1994 In E. coli recombination is 50-fold more likely to change a nucleotide site than mutation Multiple locus sequence typing (MLST) -> Similar recombination rates in other pathogen populations Diversity: Generation
What happens after DNA uptake? Destruction Plasmid replication Homologous Recombination Site-specific Recombination • Mobile genetic elements insert in genome: • Transposons (IS + transposase) • Integrons (attI site + integrase + gene cassette with attC site) ~1% of Vibrio genomes are annotated as transposases or integrases. V. vulnificus “super-integron” gene-capture system contains 188 attC sites and 202 orfs integrase Diversity: Generation
Mechanisms of Vertical (clonal) Diversification Vertical inheritance • Point mutations • neutral (wobble) • nonsense/frameshift • Chromosomal mutations • Deletion • Duplication • Rearrangements • 3.5 billion years in the making Diversity: Generation
How fast does the molecular clock tick? • Neutral mutation rates: • E.coli lab cultures: 0.003 mutations per genome division (Drake, 1991, 1993, 1998) • E.coli natural populations: 0.0001-0.0002 mutations per genome division • Buchnera natural populations: 0.0001-0.0002 mutations per genome division • 1-2% 16S rRNA divergence per 50 million years (Moran et al 1993) based on Buchnera • 3.5 billion years of evolution! Co-evolution of the buchnera-aphid symbiosis allows calibration of microbial evolution rate. Diversity: Generation
Fitness differences: Diversification by mutation • Evolution of growth advantage in stationary phase: older cultures out-compete younger cultures. • Mapped to mutations in rpoS (stress-response sigma factor). Finkel, et al PNAS (1999) Fig. 1. Consecutive generations of GASP mutants arise in the same culture. Progressively aged cultures were mixed. (A) One-day-old in the majority (solid line) vs. 10-day-old in the minority (broken line). (B) Ten-day-old in the majority (solid line) vs. 20-day-old in the minority (broken line). (C) Twenty-day-old in the majority (solid line) vs. 30-day-old in the minority (broken line). Asterisks indicate that cfu ml-1 were below the limit of detection (<102 cfu ml-1). Diversity: Generation
So far:There is vast (unknown) diversity of 16S rRNA ribotypesThere is even more genomic diversity associated with those ribotypesThere are many mechanisms for microbial diversification… So, what drives the cohesion of populations into the recognizable types we can observe? Diversity: Generation
The frequency of recombination falls off exponentially with the degree of genomic DNA sequence divergence. Bacillus, Staphylococcus and E. coli Fraser, Science 2007
gene transfer among closely related strains Is homologous recombination more likely within phylogenetic clusters?
Microbial phylogenetic taxa may show some degree of biological isolation(similar to Mayr 1942) • Zebra x Horse = Hebra BACTERIAL “SPECIES” ~97% rRNA SIMILARITY HUMAN & DONKEY ~99% rRNA SIMILARITY
A test: Do sequence clusters have coherent environmental dynamics? Population 2 Population 1 XY ABC ? % 1 2 Cohesive sequence clusters = ecotypes?
Units of Biology Biological species Phylotypes Reproductive Isolation Single lineage Pattern Pluralism Multiple models relevant Ecotypes Ecological niche
Biological species Phylotypes Pattern Pluralism Ecotypes Operational Taxonomy • Phylotypes • Proxies for evolutionary species • Single-lineage of ancestral populations/smallest diagnostable cluster of individuals • (Cracraft, 1983; Eldregde and Cracraft 1980) • Debatable assumption: • The evolutionary history for the biomarker gene is a (good) proxy for the evolutionary history of the organism. • Examples • 16S ribosomal RNA • Housekeeping genes
Biological species Phylotypes Pattern Pluralism Ecotypes Operational Taxonomy • Biological Species • Earnst Mayr, 1942 • Groups of organisms that can interbreed • Reproductive isolation • Homologous recombination in microbes may enable bio-species like evolution • Observed in microbes through multi-locus sequence typing (MLST) or whole-genome comparisons
Biological species Phylotypes Pattern Pluralism Ecotypes Operational Taxonomy • Ecological Species (Ecotype) • Lineage that occupies an ecological niche (adaptive zone) • Definition allows for “hybridization” events if niche is unchanged • Observed in microbes through population dynamics • Van Valen, 1976
Biological species Phylotypes Pattern Pluralism Ecotypes Operational Taxonomy • Pattern Pluralism • Similarities and differences between organisms may be accounted for by evolutionary mechanisms, however a single-tree like pattern (tree of life) is not the expected outcome. • “Different evolutionary models and representations of relationships will be appropriate, and true, for different taxa or at different scales or for different purposes” • Doolittle and Bapteste, PNAS 2007
“Pattern Pluralism” in Chimeric Thermotoga “Different parts of a genome may belong to different biological Species if our species concept is based on the ability to share Information by homologous recombination.” Nesbo, Dlutek and Doolittle, 2006
Diversity Metrics* *Conclusions subject to debate!
Lecture Outline • Diversity - • definitions and measurement • Generation - • vertical and horizontal mechanisms • Persistence - • Neutral Theory • Niche Theory • Ecological trends in pelagic systems
Paradox of the plankton 1961 G. E. Hutchinson (Am. Nat. 95:137-145) “The problem that is presented by the phytoplankton is essentially how is it possible for a number of species to co-exist in a relatively isotropic or unstructured environment all competing for the same sorts of materials?”
Persistence of Diversity • Neutral Theory • stochastic interactions and dispersal • Niche Theory • Specialization • Environmental heterogeneity
Neutral Theories • Unified Neutral Theory of Biodiversity (Hubble, 2001) • Seek to explain community level patterns without (before) invoking specialization of species. • Highly similar (ecologically-equivalent or functionally-redundant) species co-exist by stochastic mechanisms. • Diversity is a balance of immigration and local extinction How strong is “purifying selection” over the scale of ocean mixing?
Neutral Theories • Island biogeography (MacArthur and Wilson, 1967) • Number of species on a island is determined by effect of distance from mainland and the island size. • Many types of “islands”: habitat surrounded by an inhabitable environment (fish, marine snow…) • New species are created by isolation of gene pools and drift (allopatric speciation)
Specialization: Niche Theory Fundamental Niches (Hutchinson, 1958) Niche #2 pO2 Niche #1 Temperature
Specialization: Niche Theory Fundamental Niche Realized Niche pO2 Niche #3 Niche #1 Competition = Niche Overlap Temperature
Specialization: Niche Theory e.g. Carbon Source pO2 Niche #1 Specialization = Co-existence Temperature