Unit 8: Presenting Data in Charts, Graphs and Tables
420 likes | 618 Vues
Unit 8: Presenting Data in Charts, Graphs and Tables. #1-8-1. Warm Up Questions: Instructions. Take five minutes now to try the Unit 8 warm up questions in your manual. Please do not compare answers with other participants. Your answers will not be collected or graded.

Unit 8: Presenting Data in Charts, Graphs and Tables
E N D
Presentation Transcript
Warm Up Questions: Instructions • Take five minutes now to try the Unit 8 warm up questions in your manual. • Please do not compare answers with other participants. • Your answers will not be collected or graded. • We will review your answers at the end of the unit. #1-8-2
What You Will Learn • By the end of this unit you should be able to: • list the variables for analysing surveillance data • identify the types of charts and graphs and when the use of each is appropriate #1-8-3
Analysing Surveillance Data • Person:Who develops a disease (for example, by age group or sex)? Are the distributions changing over time? • Place:Where are cases occurring? Is the geographical distribution changing over time? • Time:Is the number of reported cases changing over time? #1-8-4
Purpose of Displaying Data • The purpose of developing clearly understandable tables, charts and graphs is to facilitate: • analysis of data • interpretation of data • effective, rapid communication on complex issues and situations #1-8-5
Types of Variables • Categorical variables refer to items that can be grouped into categories. • Ordinal variables are those that have a natural order. • Nominal variables represent discrete categories without a natural order. • Dichotomous variables have only two categories • Continuous variables are items that occur in numerical order. #1-8-6
General Rules for Displaying Data • Simpler is better. • Graphs, tables and charts can be used together. • Use clear descriptive titles and labels. • Provide a narrative description of the highlights. • Don’t compare variables with different scales of magnitude. #1-8-7
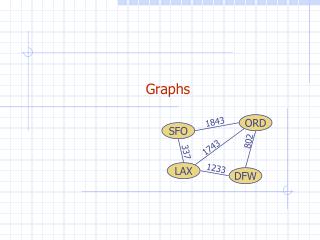
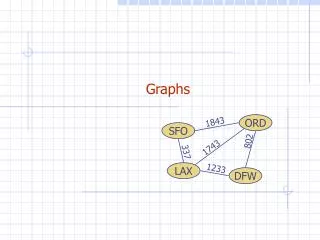
Graphs • A diagram shown as a series of one or more points, lines, line segments, curves or areas • Represents variation of a variable in comparison with that of one or more other variables #1-8-8
Scale Line Graph • Scale line graph: represents frequency distributions over time • Y-axis represents frequency. • X-axis represents time. #1-8-9
Example: Scale Line Graph Figure 8.1. Trends in HIV prevalence among pregnant women in Country X, years 1 – 10 Year #1-8-10
Specific Rules: Scale Line Graphs • Y-axis should be shorter than X-axis • Start the Y-axis with zero • Determine the range of values needed • Select an interval size #1-8-11
Bar Charts • Uses differently coloured or patterned bars to represent different classes • Y-axis represents frequency • X-axis may represent time or different classes #1-8-12
Example: Bar Chart Figure 8.2. Differences in HIV prevalence among various high-risk groups, Country X, year 1. #1-8-13
Specific Rules: Bar Charts • Arrange categories that define bars in a natural order (for example, age). • If natural order does not exist, define categories by name, such as country, sex or marital status. • Position the bars either vertically or horizontally. • Make bars the same width. • Length of bars should be proportional to the frequency of event. #1-8-14
Clustered Bar Charts • Bars can be presented as clusters of sub-groups in clustered bar charts. • These are useful to compare values across categories. • They are sometimes called stacked bar charts. #1-8-15
Example: Clustered Bar Chart Figure 8.3. HIV prevalence rate among pregnant 15- to 19-year-olds at 4 clinic sites, City X, Country Y, years 1 – 3 #1-8-16
Specific Rules: Clustered Bar Charts • Show no more than three sub-bars within a group of bars. • Leave a space between adjacent groups of bars. • Use different colours or patterns to show different sub-groups for the variables being shown. • Include a legend that interprets the different colours and patterns. #1-8-17
Histograms • A representation of a frequency distribution by means of rectangles • Width of bars represents class intervals and height represents corresponding frequency #1-8-18
Example: Histogram Figure 8.4. Children living with HIV, District X, 2002 #1-8-19
Pie Charts • A circular (360 degree) graphicrepresentation • Compares subclassesor categories to the whole class orcategory using differently coloured orpatterned segments #1-8-20
Example: Pie Chart Figure 8.5. Projected annual expenditure requirements for HIV/AIDS care and support by 2005, by region #1-8-21
Area Maps • A graph used to plot variables by geographic locations #1-8-22
Example: Area Map Figure 8.6. HIV Prevalence in Adults in Africa, end 2003 Source: UNAIDS, 2003 #1-8-23
Tables • A rectangular arrangement of data in which the data are positioned in rows and columns. • Each row and column should be labelled. • Rows and columns with totals should be shown in the last row or in the right-hand column. #1-8-24
Example: Table Region Adults and adolescents ≥ 15 years Children <15 years Total 1 14 800 200 15 000 2 400 000 20 000 420 000 3 997 000 3 000 1 000 000 4 985 000 15 000 1 000 000 5 1 460 000 40 000 1 500 000 6 465 000 35 000 500 000 7 940 000 10 000 950 000 8 380 000 220 000 600 000 9 900 000 600 000 1 500 000 10 545 000 5 000 550 000 Total 7 086 800 948 200 8 035 000 Table 8.1. Adults and children with HIV/AIDS by region in Country Y, end year X #1-8-25
In Summary • Surveillance data can be analysed by person, place or time. • Depending on your data, you can choose from a variety of chart and graph formats, including pie charts, histograms, tables, etc. • Using several simpler graphics is more effective than attempting to combine all of the information into one figure. #1-8-26
Warm Up Review • Take a few minutes now to look back at your answers to the warm up questions at the beginning of the unit. • Make any changes you want to. • We will discuss the questions and answers in a few minutes. #1-8-27
Answers to Warm Up Questions 1. List two demographic variables by which surveillance data can be analysed. #1-8-28
Answers to Warm Up Questions, Cont. 1. List two demographic variables by which surveillance data can be analysed. Age, sex, marital status, etc. #1-8-29
Answers to Warm Up Questions, Cont. 2. True or false? Compiling all the data into one comprehensive chart or graph is more effective than including many simpler diagrams. #1-8-30
Answers to Warm Up Questions, Cont. 2. True or false? Compiling all the data into one comprehensive chart or graph is more effective than including many simpler diagrams. False #1-8-31
Answers to Warm Up Questions, Cont. 3. Which of the following cannot be extracted from public health surveillance data: a.changes over time b.changes by geographic distribution c.differences according to subject’s sex d. none of the above #1-8-32
Answers to Warm Up Questions, Cont. 3. Which of the following can not be extracted from public health surveillance data: a.changes over time b.changes by geographic distribution c.differences according to subject’s sex d. none of the above #1-8-33
Answers to Warm Up Questions, Cont. • Match the type of chart/graph with its example. #1-8-34
Answers to Warm Up Questions, Cont. 4. Match the type of chart/graph with its example: scale line graph: d area map: c pie chart: a histogram: b #1-8-35
Small Group Discussion: Instructions • Get into small groups to discuss these questions. • Choose a speaker for your group who will report back to the class. #1-8-36
Small Group Reports • Select one member from your group to present your answers. • Discuss with the rest of the class. #1-8-37
Case Study: Instructions • Try this case study individually. • We’ll discuss the answers in class. #1-8-38
Case Study Review • Follow along as we go over the case study in class. • Discuss your answers with the rest of the class. #1-8-39
Questions, Process Check • Do you have any questions on the information we just covered? • Are you happy with how we worked on Unit 8? • Do you want to try something different that will help the group? #1-8-40