Download
1 / 21
210 likes | 226 Vues
Explore the environmental processes controlling dormancy in Calanus finmarchicus to develop a mechanistic understanding for population dynamics modeling. Utilize data from various sources and proxies for dormancy entry/exit to identify cues. No single cue explains dormancy patterns; lipid accumulation hypothesis is a potential dormancy control mechanism. Conclusions suggest a multi-factor regulation involving lipid accumulation and multiple environmental factors. An individual-based model integrates food and temperature history for lipid production during dormancy transitions. Explore the impact of mortality and a lipid accumulation window for dormancy. The model aims to simulate the seasonal cycle at different stations using the same parameters.

E N D
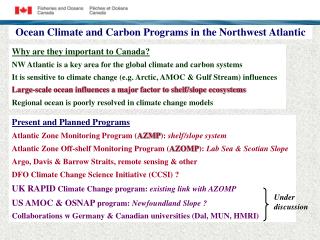
Characteristics of Calanus finmarchicus dormancy patterns in the northwest Atlantic Catherine Johnson Fisheries and Oceans, Bedford Institute of Oceanography Andrew LeisingNOAA, Southwest Fisheries Science Center Jeffrey RungeSchool of Marine Sciences, U. of Maine and Gulf of Maine Research Institute Erica HeadFisheries and Oceans, Bedford Institute of Oceanography Pierre Pepin Fisheries and Oceans, Northwest Atlantic Fisheries Centre Stéphane Plourde Fisheries and Oceans, Institut Maurice Lamontagne Edward DurbinGraduate School of Oceanography, University of Rhode Island GLOBEC NWA 4B SI meeting, Woods Hole, 29 Oct 2007
Objectives: • Identify environmental processes that control dormancy in Calanus finmarchicus • Develop a mechanistic understanding of dormancy for inclusion in population dynamics modeling • Approach: • Compile Calanus and environmental data across regions in the NW Atlantic • Look for common patterns and cues • Using an individual-based model, test quantitative hypotheses to explain patterns
Data sources Data from: DFO – AZMP: 1999 – 2005 (E.Head, P.Pepin) DFO – IML:1990 – 1991 (S. Plourde, P. Joly) US-GLOBEC: 1995 – 1999 (E. Durbin, M. Casas) PULSE – NEC: 2003 – 2005 (R. Jones)
Proxies for dormancy entry and exit Dormancy Entry (Onset)Fifth copepodid (CV) half-max proxy Dormant when… CV proportion ≥x / 2 where x = average max. CV proportion over all years Exit (Emergence)Emergence when… 1. Adult (CVI) proportion ≥ 0.1 2. Back-calculation from early copepodid appearance, using development time-temperature relationship B. Zakardjian
Abundance (no. m-2) Stage Proportion AG: Anticosti Gyre, NW Gulf of St. Lawrence OnsetEmergence
Possible dormancy cues Emergence Photoperiod(Miller et al., 1991; Speirs et al., 2004) Disturbance(Miller & Grigg, 1991) Development(Hind et al., 2000) Onset Photoperiod(Miller et al., 1991) Temperature(Niehoff & Hirche, 2005) Food availability(Hind et al., 2000) Lipid accumulation (hormonal link?)(Irigoien, 2004)
Onset of dormancy ANOVA NS, Newfoundland Shelf; AG, Anticosti Gyre; LSLE, lower St Lawrence estuary; SS, Scotian Shelf.
Climatological temperature at 5 m Newfoundland Anticosti Gyre Temperature (°C) Rimouski Onset Emergence Scotian Shelf Day of Year
Mean chlorophyll-a, 0 – 50 m Newfoundland Anticosti Gyre Log(chl-a (mg m-3)) Rimouski Onset Emergence Scotian Shelf --- half-saturation [Chl-a] Day of Year
Emergence from dormancy ANOVA NS, Newfoundland Shelf; AG, Anticosti Gyre; LSLE, lower St Lawrence estuary; SS, Scotian Shelf.
Dormancy duration is not related to deep water temperature during dormancy Dormancy duration is inversely related to surface temperature at onset
Conclusions • No single observed environmental cue explains dormancy patterns • Dormancy entry and emergence occur over a broad range of times, both among individuals and years The mechanistic understanding of dormancy transitions must involve interaction of multiple environmental factors. The lipid accumulation hypothesis is a possible multiple-factor dormancy control mechanism.
Lipid accumulation window hypothesis: Individuals can only enter dormancy if their food and temperature history allows them to accumulate sufficient lipid • Development rate increases faster with temperature than growth rate • Lipid production integrates temporally variable food and temperature history • An additional cue acting prior to stage CV may be required • Mortality also influences probability of reaching CV stage Miller et al. 1977. Growth rules in the marine copepod genus Acartia. L&O. 22: 326-335.
Female C5 C5 DVM diapause C4 Foraging Behavior C1-3 N4-6 N3 N1-2 Non-feeding Egg Growth rate, G: G = gmax * Food / (ks + Food) Where, gmax = b + m*ln (T) b and m are empirically fit* Development rate, R: R = Ω* a (T + b) -2.05 a and b are empirically fit Where Ω is a penalty function that decreases development rate at extremely low food levels Mortality: Each stage has a fixed mortality rate (decreasing logarithmically by stage) Copepods also die if their age within stage is greater than that predicted at their minimum allowable T Calanus IBM overview The model groupings *Data for empirically fit parameters from Campbell et al. (2001), Vidal (1980), and/or Peterson (1986), depending on species
Lipid accumulation window hypothesis:Decision to enter dormancy in stage CV is made in stage CIV. Criterion is attainment of 30% lipid content by weight Food index (relative to half-saturation constant)
Model objective Identify a dormancy response that allows the model to simulate the seasonal cycle at all stations using the same parameters. Run IBM at four stations using - Climatological temperature and food conditions of each station - Same parameters and dormancy response at all stations
males Anticosti Gyre Observed climatology Model simulation
males Rimouski Observed climatology Model simulation
Next Steps Test LAW model against C. finmarchicus life cycle data sets in the NW Atlantic. Does the model reproduce variability in individual years? Test refined and alternative hypotheses - Additional conditions required? Examine mechanisms for emergence from dormancy: parameterization of metabolic limitation of diapause duration (Saumweber and Durbin, 2006) Examine influence of climate change scenarios on Calanus life cycle and population dynamics Further testing with time series observations, include measures of lipid levels in CIV and CV
Individual-based model Lipid fraction (i.e. the fraction of food that goes to lipid) FL = Fmax*Prey/(Ksf+prey) Fmax is the maximum fraction of food that can be allocated to lipid Ksf is a half saturation constant, which is different from Ks *There is a threshold below which FL = 0 Emergence Copepods develop at a reduced rate during dormancy (1/25th). They emerge either at the end of the slow CV stage or when lipid levels decline to 10%.