Download
1 / 38
380 likes | 553 Vues
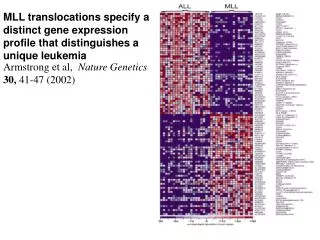
MLL translocations specify a distinct gene expression profile that distinguishes a unique leukemia. Armstrong et al, Nature Genetics 30, 41-47 (2002). E. Canaani: A.L.L. LEUKEMIA 27 PATIENTS, 14 with MLL translocation, (“MLL”) 13 without (ALL). E, C&N_log2E.

E N D
MLL translocations specify a distinct gene expression profile that distinguishes a unique leukemia Armstrong et al, Nature Genetics 30, 41-47 (2002)
E. Canaani: A.L.L. LEUKEMIA 27 PATIENTS, 14 withMLL translocation, (“MLL”) 13 without (ALL) E, C&N_log2E log2 E, center, normalize expression matrix E 3250 genes passed filter
E. Canaani: A.L.L. LEUKEMIA 27 PATIENTS, 14 withMLL translocation, (“MLL”) 13 without (ALL) MLL ALL
AIM: FIND THE GENES THAT ARE EITHER ACTIVATED OR SUPPRESSED BY THE t(4,11) CHIMERIC MLL PROTEIN THESE GENES MAY BE THE CAUSE OF CANCER AND TARGETS FOR THERAPY Rozovskaia, Ravid, Getz, ....., Canaani: PNAS (2003)
Basic methodologies1 t(4:11) MLL ALL without t(4:11) SUPERVISED ANALYSIS: HYPOTHESIS TESTING USING CLINICAL INFORMATION (MLL/ALL=NO TRANS.) IDENTIFY DIFFERENTIATING GENES HYPOTHESIS: THE EXPRESSION LEVELS OF GENE g IN SAMPLESWITH THE MLL TRANSLOCATION AND WITHOUT –ARE DRAWN FROM THE SAME DISTRIBUTION USE STANDARD STATISTICAL TESTS, FOR ONE GENE AT A TIME TO CALCULATE Pg = probability that the 27 expression levels of gene g (14 from MLL, 13 ALL) are taken from the same distribution
Cluster Incl. U70321:Human herpes virus entry mediator mRNA gene10 MLL: -1.0522 -0.5557 -1.0522 -0.6297 -1.0522 -0.7643 -0.4200 -0.7931 -1.0522 -0.7548 -1.0522 -0.5799 0.0225 -0.8326 mean = -0.76 std = 0.3 ALL: 2.1513 0.5143 0.0709 0.0421 0.9885 1.1993 2.0765 -0.0126 1.2574 0.2553 0.5241 -0.2726 1.7740 mean = 0.81 std = 0.82
histograms mean = -0.76 std = 0.3 mean = 0.81 std = 0.82
T = -6.6 P = 6e-7 t-test
Cluster Incl. AB005298:Homo sapiens BAI 2 mRNA MLL: 0.3449 1.1137 0.2628 -0.5576 0.3116 1.4970 0.0126 -1.2401 -1.2401 -1.2401 -0.6049 -1.2401 0.0520 -1.2401 mean = -0.27 std = 0.92 ALL: 1.5279 2.0361 -0.2097 0.4142 -1.2401 0.5464 0.8569 -0.9042 0.8856 0.5590 -0.4396 -1.2401 0.9760 mean = 0.29 std = 1.00
NORMALIZED (FREQUENCIES) mean = -0.27 std = 0.92 mean = 0.29 std = 1.00
85% T = -1.48 P = 0.15 t-test
genes ordered by p-value 929 genes with p < 0.05 ordered by difference of means (ALL –MLL)
143 genes with p < 0.05 (OUT OF 3250 GENES TESTED) RANDOM DATA ALL MLL 929 genes with p < 0.05 (OUT OF 3250 GENES TESTED)
143 genes with p < 0.05 (OUT OF 3250 GENES TESTED) RANDOM DATA
BEWARE OF MULTIPLE COMPARISONS!!! after ttest 0.05 order by diffmeans Bonferroni: reject H0 only for genes with p < 0.05 / N p < 0.05/3250 = 1.5 10-5 Bonferroni – 30 pass at 0.05 This list of 30 genes is “error free” with prob. 0.95 929 genes with p < 0.05
genes ordered by p-value 929 genes with p < 0.05 ordered by difference of means (ALL –MLL)
143 WITH P-value<0.05 RANDOM DATA 929 genes with p < 0.05
how many genes at FDR=0.05? 297*0.05=15 false separating genes
15 out of 297 - false 15 - false
MLL translocations specify a distinct gene expression profile that distinguishes a unique leukemia Armstrong et al, Nature Genetics 30, 41-47 (2002) PROBLEM: HIDDEN, CONFOUNDING VARIABLES( (FACTORS)
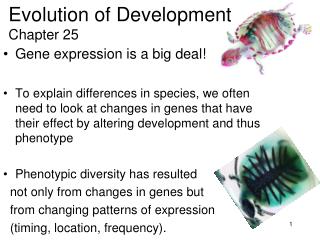
LEUKEMIA MALIGNANCY, INDUCED BY MUTATIONS, TRANSLOCATION,.. STEM CELLS: immortal, (unlimited number of divisions) multipotent (differentiation into many targets) Mature cells: finite lifetime, finite number of divisions fixed class (B stays B etc) differentiation HEMATOPOIESIS: Differentiation from STEM CELLS to mature cells LEUKEMIA: B T ACUTE LYMPHOID LEUKEMIA (ALL) NK ACUTE MYELOID LEUKEMIA (AML) Red Hematopoiesis: HSCs can be categorized into long-term self-renewing HSCs, short-term self-renewing HSCs and multipotent progenitors (red arrows indicate self renewal). HSC give rise to common lymphoid progenitors (CLPs) and to common myeloid progenitors (CMPs). CMPs mature into red blood cells, megakaryocyte (cells producing platelets), granulocytes, dendritic cells, and macrophages. The CLP differentiate into B and T cell lymphocytes, natural killer cells and dendritic cells. (adapted from Reya et al., 2001)
DIFFERENTIATION PRO B-cell ALL PRE B-cell ALL PRE T-cell ALL LEUKEMIA: MALIGNANCY INDUCED BY MUTATION OR TRANSLOCATION • UNCONTROLED PROLIFERATION • OVERCROWDING & DEATH OF • NORMAL CELLS normal differentiation • ARREST OF DIFFERENTIATION EARLY LATE LATE
TRANSLOCATION MLL – GENE ON BAND 23 OF CHROMOSOME 11 AF4 – GENE ON BAND 21 OF CHROMOSOME 4 partner gene AF4 t(4,11) MLL fusion protein TRANSLOCATION: DURING DNA REPLICATION TWO STRANDS, FROM TWO DIFFERENT CHROMOSOMES, CROSS MLL TRANSLOCATIONS ARE IMPLICATED IN 10% OF ALL AND IN UP TO 80% OF INFANT LEUKEMIA
AIM: FIND THE GENES THAT ARE EITHER ACTIVATED OR SUPPRESSED BY THE t(4,11) CHIMERIC MLL PROTEIN THESE GENES MAY BE THE CAUSE OF CANCER AND TARGETS FOR THERAPY Rozovskaia, Ravid, Getz, ....., Canaani: PNAS (2003)
CANAANI ALL without t(4:11) t(4:11) MLL t(4:11) MLL ALL without t(4:11) ?? 230 genes differentially expressed between ALL with t(4:11) and ALL without, at FDR = 0.05. EXPRESSION DATA: 27 ALL samples, 14 with MLL TRANS. t(4,11) 13 without TRANS. 3060 GENES PASSED FILTER There is another factor (differentiation) that separates these two groups of samples! Which of the 230 genes responds to the MLL translocation? USE STANDARD STATISTICAL TEST TO LOOK FOR GENES THAT SEPARATE t(4,11) MLL FROM ALL: PROBLEM OF MULTIPLE COMPARISONS SOLVED BY CONTROLLING THE FALSE DISCOVERY RATE (FDR)
MLL vs ALL FDR = 5% 448 genes Differentiation sensitive Translocation sensitive 46 80 MLL vs CD10- FDR = 12% 144 genes ALL vs CD10- FDR = 12% 167 genes T, Pre-B ALL MLL CD10- WHERE ARE THE MLLs THAT LOOK LIKE ALL? Sensitive to Trasloc. and/or Differentiation Sensitive to Translocation and/or CD10- Sensitive to Differentiation and/or CD10-
AIM: FIND THE GENES THAT ARE EITHER ACTIVATED OR SUPPRESSED BY THE t(4,11) CHIMERIC MLL PROTEIN FINDING: WE IDENTIFIED 46 GENES THAT ARE ACTIVATED OR SUPPRESSED BY THE MLL ONCOGENE. TARGETS OF NEXT STAGE EXPERIMENTS ON MICE SPINOFF: SOME MLLS ARE LATE DIFFERENTIATORS Rozovskaia et al. PNAS 2003
= E1- 2E2 < 0 = E1- 2E2 > 0 E2 separation MLL E1-2E2= 0 E1 ALL
w E2 projection 1 MLL E1 ALL +/- PROJECTIONS ON w – DO SEPARATE ALL FROM MLL
w’ E2 projection 2 MLL E1 ALL +/- PROJECTIONS ON w’ – DO NOT SEPARATE ALL FROM MLL
E2 projection 3 E1 WELL SEPARATED CENTERS OF MASS - NO SEPARATION OF THE TWO CLOUDS
E2 WEAK SEPARATION OF CENTERS OF MASS – GOOD SEPARATION OF THE TWO CLOUDS projection 4 E1
FISHER OPTIMAL LINE TO PROJECT ON E2 Fisher to perceptron MLL PERCEPTRON E1 ALL