Download

1 / 44
440 likes | 571 Vues
MLL translocations specify a distinct gene expression profile that distinguishes a unique leukemia. Armstrong et al, Nature Genetics 30, 41-47 (2002). Blank slide/colon data. Hsa.37937 3' UTR 2a 197371 MYOSIN HEAVY CHAIN, NONMUSCLE (Gallus gallus). gene1. tumor:.

E N D
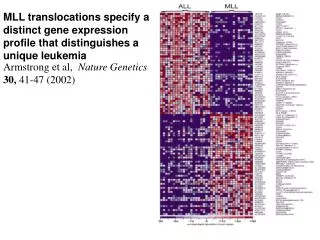
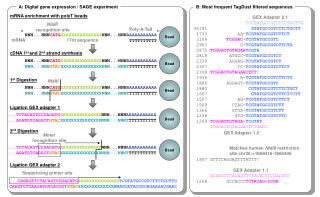
MLL translocations specify a distinct gene expression profile that distinguishes a unique leukemia Armstrong et al, Nature Genetics 30, 41-47 (2002)
Hsa.37937 3' UTR 2a 197371 MYOSIN HEAVY CHAIN, NONMUSCLE (Gallus gallus) gene1 tumor: 1.62 1.33 0.79 0.41 0.39 0.38 1.22 1.57 0.72 0.97 1.12 0.61 0.79 0.36 0.52 0.58 0.44 0.35 0.53 0.52 0.46 0.59 0.68 0.27 0.67 0.49 0.49 0.53 0.35 1.44 0.55 0.33 1.70 0.59 0.73 1.54 1.03 0.54 0.66 0.33 mean = 0.73 std = 0.4 normal: 2.81 2.18 2.68 2.17 2.84 2.58 4.97 2.12 2.76 3.41 2.72 3.26 2.51 1.24 2.83 1.25 4.22 1.06 2.30 0.44 1.21 1.57 mean = 2.41 std = 1.05
histograms 2.812.182.682.172.842.584.972.122.76 3.41 2.72 3.26 2.511.242.831.254.221.062.300.441.211.57 HISTOGRAM, BINS OF 0.5 0.5 1.0 1.5 2.0 2.5 3.0 3.5 4.0 4.5 5 1 3 2 3 5 4 2 1 1
NORMALIZED (FREQUENCIES) mean = 0.73 std = 0.4 mean = 2.41 std = 1.05
T = -9.04 P = 10 e-14 t-test
Hsa.37192 3' UTR 2a 186603 EUKARYOTIC INITIATION FACTOR 4B (Homo sapiens) gene1000 tumor: 0.21 0.38 0.51 0.23 0.23 0.32 0.20 0.53 0.33 0.47 0.25 0.22 0.36 0.26 0.27 0.26 0.26 0.33 0.30 0.15 0.25 0.18 0.19 0.28 0.25 0.25 0.54 0.20 0.41 0.47 0.49 0.39 0.33 0.44 0.37 0.42 0.34 0.35 0.56 0.37 mean = 0.328 std = 0.111 normal: 0.20 0.32 0.62 0.21 0.31 0.25 0.24 0.40 0.25 0.50 0.19 0.37 0.63 0.33 0.41 0.48 0.59 0.45 0.48 0.31 0.30 0.41 mean = 0.375 std = 0.134
85% T = -1.48 P = 0.15 t-test
Hsa.1829 gene 1 Human mRNA fragment for class II histocompatibility antigen beta-chain (pII-beta-4). gene2000 tumor: 1.50 2.53 2.38 3.16 3.01 2.45 1.70 2.10 3.14 2.76 1.57 4.15 3.60 5.32 2.20 1.82 2.81 5.33 4.03 2.28 1.48 2.03 1.75 1.64 2.92 1.26 1.75 2.03 2.45 2.25 2.82 3.87 1.67 1.22 2.49 1.74 4.96 1.49 1.38 5.98 mean = 2.6258 std = 1.2039 normal: 1.56 3.07 4.15 8.12 3.41 3.78 1.42 0.96 2.09 2.63 2.29 2.11 1.26 1.85 1.61 3.18 2.23 1.02 3.36 3.63 2.11 1.93 mean = 2.6261 std = 1.536
T = - 0.001 P = 0.9992 t-test
log2 E, center, normalize E, C&N_log2E colon date expression matrix E
genes ordered by p-value 726 genes with p < 0.05 ordered by difference of means (normal – tumor)
after ttest 0.05 order by diffmeans RANDOM DATA genes with p < 0.05
Q=0.15 sorted p I=758
0.14 how many out of 726 are false? FDR: 726*0.14=101 false separating genes
how many genes at FDR=0.05? 516*0.05=26 false separating genes
26 out of 516 - false 26 - false
MLL translocations specify a distinct gene expression profile that distinguishes a unique leukemia Armstrong et al, Nature Genetics 30, 41-47 (2002)
= E1- 2E2 < 0 = E1- 2E2 > 0 E2 separation MLL E1-2E2= 0 E1 ALL
w E2 projection 1 MLL E1 ALL +/- PROJECTIONS ON w – DO SEPARATE ALL FROM MLL
E2 projection 2 MLL E1 ALL +/- PROJECTIONS ON w – DO NOT SEPARATE ALL FROM MLL
E2 projection 3 E1 WELL SEPARATED CENTERS OF MASS - NO SEPARATION OF THE TWO CLOUDS
E2 WEAK SEPARATION OF CENTERS OF MASS – GOOD SEPARATION OF THE TWO CLOUDS projection 4 E1
FISHER OPTIMAL LINE TO PROJECT ON E2 Fisher to perceptron MLL PERCEPTRON E1 ALL
Unsupervised analysis CLUSTERING • UNSUPERVISED ANALYSIS • GOAL A: FIND GROUPS OF GENES THAT HAVE CORRELATED EXPRESSION PROFILES. THESE GENES ARE BELIEVED TO BELONG TO THE SAME BIOLOGICAL PROCESS. • GOAL B: DIVIDE TISSUES TO GROUPS WITH SIMILAR GENE EXPRESSION PROFILES. THESE TISSUES ARE EXPECTED TO BE IN THE SAME BIOLOGICAL (CLINICAL) STATE.
Dendrogram1 CLUSTER ANALYSIS YIELDS DENDROGRAM T (RESOLUTION)
BUT WHAT ABOUT THE OKAPI? Giraffe + Okapi
Statement of the problem2 STATEMENT OF THE PROBLEM GIVEN DATA POINTS Xi, i=1,2,...N,EMBEDDED IN D - DIMENSIONAL SPACE, IDENTIFY THE UNDERLYING STRUCTURE OF THE DATA. AIMS:PARTITION THE DATA INTO M CLUSTERS, POINTS OF SAME CLUSTER - "MORE SIMILAR“ M ALSO TO BE DETERMINED! GENERATE DENDROGRAM, IDENTIFY SIGNIFICANT, “STABLE” CLUSTERS "ILL POSED": WHAT IS "MORE SIMILAR"? RESOLUTION
Dendrogram2 YOUNG OLD CLUSTER ANALYSIS YIELDS DENDROGRAM LINEAR ORDERING OF DATA T
2 4 5 3 1 1 3 2 4 5 Need to define the distance between thenew cluster and the other clusters. Single Linkage: distance between closest pair. Complete Linkage: distance between farthest pair. Average Linkage: average distance between all pairs or distance between cluster centers Agglomerative Hierarchical Clustering Distance between joined clusters The dendrogram induces a linear ordering of the data points Dendrogram
Hierarchical Clustering -Summary • Results depend on distance update method • Greedy iterative process • NOT robust against noise • No inherent measure to identify stable clusters
2 good clouds COMPACT WELL SEPARATED CLOUDS – EVERYTHING WORKS
2 flat clouds 2 FLAT CLOUDS - SINGLE LINKAGE WORKS
filament SINGLE LINKAGE SENSITIVE TO NOISE
2 4 5 3 1 1 3 2 4 5 Need to define the distance between thenew cluster and the other clusters. Average Linkage: average distance between all pairs Average linkage Distance between joined clusters Dendrogram