Download
1 / 20
200 likes | 214 Vues
Detailed analysis of Ocean Biology Processing Group's method to calculate ocean color radiance from MODIS Aqua imagery for enhanced remote sensing precision. Highlights the impact of PSF, NFR, LSF, and stray light. Acknowledges data sources from SBRS/Raytheon. [Word Count: 45]

E N D
Derivation of the MODIS Aqua Point-Spread Function for Ocean Color Bands Gerhard Meistera, Yuqin Zongb, Charles McClainc a: OBPG (Ocean Biology Processing Group; Futuretech) b: National Institute of Standards and Technology, Gaithersburg c: OBPG (Ocean Biology Processing Group; NASA) August 11, 2008 Earth Observing Systems XIII, SPIE Optonics + Photonics 2008, San Diego
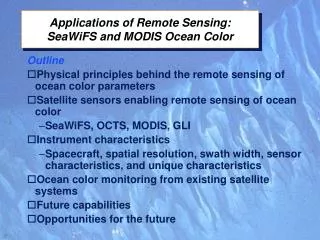
Background • Ocean color products (e.g. chlorophyll) are derived from water-leaving radiances • Ocean color remote sensing imposes very stringent requirements on radiometric precision (typically only 10% or less of the TOA signal is of interest) • Oceans scenes are typically a mixture of cloud and ocean pixels • Radiometric quality reduced near high contrast ratio for any imaging sensor
MODIS Optical Path Page 3
PSF definition: Lm (i0,j0) = Sij PSF(i- i0,j- j0)*LT(i,j) Lm = Measured radiance LT = True radiance PSF = Point Spread Function i = line index j = column index PSF kernel 25x25: i= i0-12, i0 -11,..., i0+11, i0+12 j= j0-12, j0 -11,..., j0+11, j0+12
Available from SBRS: • LSF (Line Spread Functions): smaller slit, 1 pixel from either side of slit, dynamic range 1-10-3, scan and (simulated) track direction • NFR (Near Field Response) measurements: scans of 1x10 slit (slit in track direction), up to 100 pixels to either side of peak, dynamic range 1-10-7 • NFR modeling: scatter model, certain shape parameters, no absolute scale for PSF Acknowledgement: NFR data provided by Roger Drake (SBRS/Raytheon), NFR model taken from James Young (SBRS/Raytheon) memo
Creation of PSF: Assume that PSF of adjacent pixel in scan direction is given by 0.125/0.75 (theoretical value from Geolocation ATBD) of center value, adjacent pixel in track direction is 5% (from LSF) Adjust center value and scale parameter from SBRS model (Harvey-Shack) so that NFR measure- ments are reproduced
PSF model in track direction Solid line: track direction, dashed line: scan direction
PSF detector dependence Left: Band 16, detector 1 Right: Band 16, detector 10
PSF effect: Large cloud, band 11 Contamination of TOA radiance over ocean due to semi-infinite cloud
PSF effect: Large cloud, all ocean bands Contamination of TOA radiance over ocean due to semi-infinite cloud
PSF effect: Small cloud, all ocean bands Contamination of TOA radiance over ocean due to 10x10 pixel cloud
Straylight effects in ocean color images (preliminary) 3 Aqua granules, one coastal, 2 open ocean A20031271435 A20030702305 A20030701810
Definition of ‘Distance to Cloud’ C = cloud pixel, number = distance to cloud Approach: Average ocean color products for each ‘Distance to Cloud’ from 1-40
Histogram of ‘Distance to Cloud’ • Black, blue, red lines for Aqua granules • 3 green lines for SeaWiFS granules • Logarithmic scale, not much data beyond ‘Distance to cloud’ 20
PSF correction algorithm • Traditional algorithms calculate stray light contribution to receiver assuming measured sender radiance is the true radiance • Calculation can be done iteratively • Matrix inversion approach: YIF = Cspat Ymeas YIF = column vector of straylight corrected image Cspat = straylight correction matrix Ymeas = column vector of measured image
Summary • MODIS has been characterized for stray light in scan direction only • PSF was developed assuming symmetry in scan and track direction • Modeled PSF predicts significant stray light contamination of ocean radiances for large clouds • MODIS Aqua image analysis suggests dependence of ocean products on distance to nearest cloud • Future: apply matrix inversion algorithm to MODIS Aqua images