Aqua PSF: Radiometric Accuracy Correction for Remote Sensing
Learn about Aqua PSF correction method for remote sensing, addressing challenges with stray light effects and computational complexity. Understand PSF definition and creation process. Evaluate radiance corrections for different cloud sizes and outlook for further refinement.

Aqua PSF: Radiometric Accuracy Correction for Remote Sensing
E N D
Presentation Transcript
MODIS Aqua PSF (Point Spread Function) Gerhard Meister, OBPG NASA Goddard Space Flight Center (Futuretech Corp.) January 4, 2006
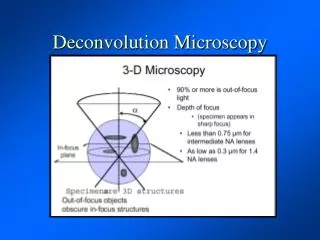
Background • Ocean color remote sensing imposes very stringent requirements on radiometric accuracy of bands relative to each other. • Stray light effects are very large for bright clouds next to dark ocean water. • Theoretical solution: correction with point-spread function (PSF). • Problems: PSF not well characterized, light source intensity sometimes unknown, computationally very expensive.
PSF definition: Lm (i0,j0) = Sij PSF(i- i0,j- j0)*LT(i,j) Lm = Measured radiance LT = True radiance PSF = Point Spread Function i = line index j = column index PSF kernel 25x25: i= i0-12, i0 -11,..., i0+11, i0+12 j= j0-12, j0 -11,..., j0+11, j0+12
Available from SBRS: • LSF (Line Spread Functions): smaller slit, 1 pixel from either side of slit, dynamic range 1-10-3, scan and (simulated) track direction • NFR (Near Field Response) measurements: scans of 1x10 slit (slit in track direction), up to 100 pixels to either side of peak, dynamic range 1-10-7 • NFR modeling: scatter model, certain shape parameters, no absolute scale for PSF
Creation of PSF: Assume that PSF of adjacent pixel in scan direction is given by 0.125/0.75 (theoretical value from Geolocation ATBD) of center value, adjacent pixel in track direction is 5% (from LSF) Adjust center value and scale parameter from SBRS model (Harvey-Shack) so that NFR measure- ments are reproduced
Summary • Created Aqua PSF based on SBRS model and NFR measurements • For huge clouds, TOA radiances 50 pixels away from cloud will be contaminated up to 1% (even after correcting with 101x101 PSF) • For 100x100 clouds, radiances will be up to 0.5% too high after correction with 25x25 PSF (0.2% for 51x51) • For small clouds, radiances can be adequately corrected with 25x25 PSF as close as 2 pixels to the cloud
Outlook: • Still need to check the model in track direction • Refinement needed for adjacent pixel • Validate with real data (nLw should ‘look better’, but more noise is expected) • If successful, implement into SeaDAS as an option • Work with MCST on Terra PSF derivation/validation