The Flux Pilot Project
170 likes | 340 Vues
NASA’s Carbon Monitoring System. The Flux Pilot Project. Steven Pawson, Mike Gunson , and the project team. Global maps of carbon fluxes derived from space-based observations. Flux-Pilot Project: The Team . HQ: Ken Jucks ARC: Chris Potter, Steve Klooster

The Flux Pilot Project
E N D
Presentation Transcript
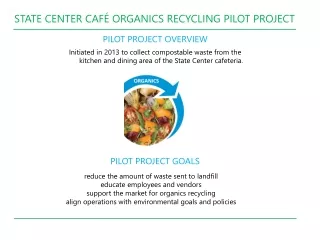
NASA’s Carbon Monitoring System The Flux Pilot Project Steven Pawson, Mike Gunson, and the project team Global maps of carbon fluxes derived from space-based observations
Flux-Pilot Project: The Team HQ: Ken Jucks ARC: Chris Potter, Steve Klooster GSFC: Steven Pawson, Jim Collatz, Watson Gregg, Randy Kawa, Lesley Ott, Cecile Rousseaux, Zhengxin Zhu JPL: Mike Gunson, Kevin Bowman, Holger Brix (UCLA), AnnmarieEldering, Josh Fisher, Chris Hill (MIT), Meemong Lee, Junjie Liu, DimitrisMenemenlis
Objectives NASA Models: Land, Ocean, Atmosphere NASA Satellite Data Other Observations MERRAreanalysis Level-3 and Level-4 products relevant to carbon monitoring • Use models to transform from observations to meaningful quantities for carbon cycle science (and policy) • Bottom-up flux estimates over land and ocean • Atmospheric forward modeling: fluxes to concentrations • Atmospheric inversions for (land biosphere) fluxes
Year-1 Objectives/Achievements • Learned (almost) how to communicate and exchange data among several different groups • Bottom-up flux estimates for July 2009-June 2010, from: • Two versions of the CASA model, constrained by data • Two different ocean models, constrained by data • Assessments of these fluxes: • Comparisons with other datasets • Comparisons of atmospheric concentrations using GEOS-5 forward model • Top-down (inverse) estimates using ACOS/GOSAT data: • GEOS-CHEM adjoint used for land biosphere fluxes • Evaluation against bottom-up computations
Enhancing communications among the land, ocean and atmosphere groups: Basic understanding … the increments in 3D-Var are positive … …the posteriors in the 4D-Var include corrections to the prior fluxes … NPP = GPP – Ra NEP = NPP – Rh NEE = – NEP … 5D-Var includes rose-colored glasses The physicist said the Atlantic is a basin, the biologist said it’s a sink … What’s up? Am I 44.0096 grams or 12.0107 grams ?
Schematic of the data flow in the two versions of the CASA land biosphere systems, with the annual GPP (gC m-2yr-1) from NASA-CASA (left) and CASA-GFED (right) NASA-CASA MODIS: EVI, land cover MERRA: Tsurf, precip, PAR Soil type map Maps of land biosphere: GPP, NPP, NEP, NBP, … MODIS: reflectance, fire, vegetation AVHRR GIMMS NDVI MERRA: Tsurf, precip, PAR Soil type map CASA-GFED NASA-CASA (ARC) CASA-GFED (GSFC) Gross Primary Productivity (GPP): the rate of uptake of Carbon from the environment
Comparison of the annual GPP (gC m-2yr-1) estimated from flux towers (MPI dataset) with the two estimates from this project, from NASA-CASA (left) and CASA-GFED (right) Upscaled FLUXNET (MPI-BGC) NASA-CASA (ARC) CASA-GFED (GSFC) Gross Primary Productivity (GPP): the rate of uptake of Carbon from the environment
The ocean carbon flux estimates from the NOBM and ECCO/Darwin systems differ in model structure and in the observational constraints imposed – annual mean fluxes (10-9 gCm-2s-1) for 2009 NOBM MODIS: Chlorophyll MERRA: Surface wind speed/stress; clouds, total ozone, humidity Maps of ocean state, including pCO2, fCO2, etc. Jason-1, OSTM/Jason-2, & Envisat sea-surface anomaly AMSR-E SST Quikscat wind stress ECCO/Darwin ECCO-2/Darwin NOBM
Comparison of the annual flux of CO2 from ocean to atmosphere according to Takahashi (LDEO) “climatology” and the two “CMS” ocean products, NOBM and ECCO for 2009. LDEO/Takahashi “climatology” ECCO-2/Darwin NOBM
Testing the impact of differing flux estimates in GEOS-5 simulations on surface CO2 concentrations at NOAA GMD monitoring stations: the run with GFED/CASA and NOBM fluxes is the most realistic GEOS-5 MERRA: Meteorology Bottom-up fluxes CO2 concentrations NASA CASA – CASA/GFED CASA/GFED + NOBM NASA CASA + NOBM XCO2 [ppmv]: deep-layer mean concentrations XCO2 [ppmv]: difference Forward model computations with different combinations of fluxes (fossil fuel, biofuel, … are from the same inventories) interpolated to GOSAT observation locations for Jan-Feb 2009 (working on the comparison with ACOS/GOSAT)
Testing the impact of differing flux estimates in GEOS-5 simulations on surface CO2 concentrations at NOAA GMD monitoring stations: the run with GFED/CASA and NOBM fluxes is the most realistic Comparing three simulations, for July 2009-June 2010, with the NOAA GMD Observations (red)shows that the two model runs with GFED/CASA (black andblue) are most realistic in the NH and the model runs withNOBM (blackand green) are most realistic in the SH (same FF emissions in all runs)
The “top-down” inverse flux estimates for land biosphere computed using the adjoint of GEOS-Chem with the CASA-GFED computations as the prior GEOS-CHEM adjoint MERRA: Meteorology GOSAT: ACOS CO2 retrievals CMS bottom-up fluxes as priors Posterior maps of land biosphere flux POSTERIOR (after inversion) minus PRIOR (CASA/GFED) Surface CO2 concentration (ppmv) Land Biosphere Flux (gCm-2day-1)
Land biospheric CO2 fluxes from the inversion estimates (based on ACOS/GOSAT) are in closer agreement than the prior states with CarbonTracker (based on surface network) Inverse estimate has a stronger NH sink and a weaker tropical sink than the prior estimate (GFED/CASA) Posterior: -4.97801 GtC/year POSTERIOR MINUS PRIOR Prior: -5.13972 GtC/year Land Biosphere Flux (gCm-2day-1)
Land biosphere carbon flux estimates by country, for CASA-GFED, NASA-CASA, and the inverse method, compared to the MPI-BGC estimates (which are based on a different type of model) ACOS-Inversion NASA CASA CASA-GFED MPI-BGC Annual CO2 flux (Petagrams)
Summary Observations NASA Models: Land, Ocean, Atmosphere Products relevant to carbon monitoring • Our strength comes from our diversity: team members’ expertise in developing and using NASA’s observations and models – connections • Bottom-up (ocean and land biophysical) and top-down (land biophysical) flux computations completed for 2009-2010and evaluated using forward model simulations • Some weaknesses isolated (related to data use and models) • Evaluation underway • Can discriminate between different sets of fluxes • Evaluation and uncertainty estimates are ongoing
Plans for FY 2012 • Improve estimates (models, use of data, …): • Bottom-up and forward (transport) model for 2005-2011 • Inverse flux estimates for July 2009-June 2011 • Evaluation and validation (independent data) • Use other data types (e.g., TES as well as ACOS) • Error analysis: • Propagation of observation errors through sub-systems • Potential model error (parameters, transport) • Absolute accuracy: • Provide a benchmark for atmospheric inversion (~OSSE)
Outreach and Communication Publish results in peer-reviewed literature Provide data to the community (web interface) Identify and communicate areas for additional scientific participation Meeting with community at AGU: Thursday evening in San Francisco Enhance communications with policy makers