Download
1 / 11
110 likes | 127 Vues
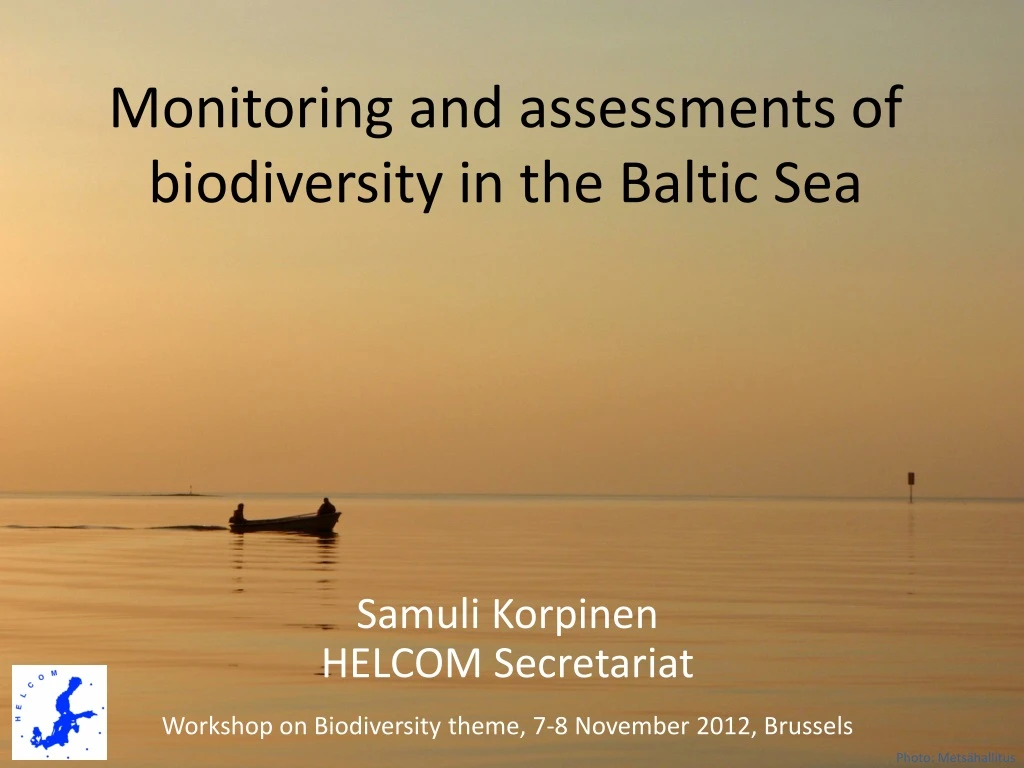
This workshop explores the monitoring and assessment system for biodiversity in the Baltic Sea, including core indicators, monitoring methods, and modeling approaches.

E N D
Monitoring and assessments of biodiversity in the Baltic Sea Samuli KorpinenHELCOM Secretariat Workshop on Biodiversity theme, 7-8 November 2012, Brussels Photo: Metsähallitus
Follow-up system for Baltic state of the environment?? Noise Populations +habitats Alien species Commercially exploited fish Food web Eutrophication Contaminants Litter Impulsive + Background noise Floating, seabed, beaches, micro, ingested Oxygen [1] Mammals [3] New NIS [1] Fish stocks [3] Fish stocks [3] Seals [1] POPs [8] Metals [1] Transparency [1] Birds [1] Birds [3] Fish community [1] Cs-137[1] Fish community [1] Nutrients [1] Coastal fish [1] Coastal fish [1] Chlorophyll [1] Bioeffects [4] Bioeffects [4] Anadromousl fish [2] Anadromousfish [2] Coastal fish [1] Coastal fish [1] Macrozoo-benthos [2] Zooplankton [1] Macrophytes [1] Habitats [2]
State of the monitoring Mammals [3] Monitoring in place, only coordination Bird populations [2] Monitoring in place, only coordination and recognition of voluntary monitoring Oiled birds Setting up a few (selected) sites in the Baltic Bycaught birds and mammals Setting up a monitoring method Coastal fish [2] Monitoring in place, DCF data to support Anadromousfish [2] Monitoring in place, models to support Fish community Monitoring in place, ICES-HELCOM coord. Fish stocks [3] Monitoring in place, ICES-HELCOM coord. Macrozoobenthos [2] Monitoring in place, method development Macrophytes [1] Gaps in monitoring Compilation of pressure data, periodic biotope assessments Habitats [2] Zooplankton [1] Monitoring in place New NIS [1] Supported by port surveys
State of marine biodiversity monitoring Photo: Metsähallitus
Revision of HELCOM monitoring strategy • 2005 Monitoring and Assessment Strategy (http://www.helcom.fi/groups/monas/en_GB/monitoring_strategy/) • 2004 Data and Information Strategy (http://www.helcom.fi/groups/monas/en_GB/datastrategy/) • Objectives in the revision process: • Support monitoring of core indicators (new parameters) • Cost-efficiency: joint cruises, specialization of institutes, responsible expert groups (updates, data flows, quality control, assessment products) • Thematic assessments, assessment tools • Leads to revised monitoring guidelines (COMBINE) • Timeline: strategy ready in mid-2013, then to the guidelines..
Monitoring and assessment system which enables evaluation of the effectiveness of measures Monitoring and assessment system that enables measuring progress towards the jointly agreed targets Optimisation of the use of natinal resources through a regional coordination system Maximisation of synergies through joint activities, specialisation and shared responsibilities: 9*1<9 High quality data and assessments through common methods and rigourous QA and QC Streamlined processes for monitoring, data flows and assessments Scientifically sound, fit for purpose and timely assessment products Processes and structures for good coordination of national activities with the aim to reach optimisation regionally Joint activities, surveys and campaigns Specialisation and sharing Sufficient funding for the coordination activities and implementation of the optimised system HELCOM expert groups responsible for assessment processes Use of HELCOM as the coordination and optimising platform of national monitoring Simple indicators to follow the implementation of the Strategy e.g. number of joint activities Review of the Strategy as needs be based on the follow-up information
HELCOM assessment tool for biodiversity assessments The preliminary HELCOM Biodiversity Assessment Tool (BEAT) was used in the Initial Holistic Assessment in 2010. It consists of: • Indicators nested in ’themes’ (e.g. populations, communities, habitats), • Reference condition + Acceptable deviation, • Weighting of individual indicators, • Five classes, • One-out-all-out principle among ’themes’, • Confidence rating of indicators, ’target’ and data Revision of the tool according to MSFD requirements: new target setting, new themes, 2 classes?, etc. Photo: S. Korpinen
Modelling approaches in monitoring and assessments • Baltic SeaAction Plan: motivates to find modelling approaches. • The BALANCE and EUSeaMap habitat models used in benthic assessments. • Noise model in LIFE+ BIAS project 2013-2014 • Modelled targets for water transparency, oxygen + nutrients: TARGREV ensemble modelling. • Revised nutrient reduction scheme in 2013. Photo: Metsähallitus