Download
1 / 23
230 likes | 346 Vues
Integrating the Monitoring of Agricultural Pests into Biodiversity Assessments. Gail E. Kampmeier Illinois Natural History Survey Institute of Natural Resource Sustainability University of Illinois at Urbana-Champaign. Agriculture as a Measure of Biodiversity. Traditionally,

E N D
Integrating the Monitoring of Agricultural Pests into Biodiversity Assessments Gail E. Kampmeier Illinois Natural History Survey Institute of Natural Resource Sustainability University of Illinois at Urbana-Champaign
Agriculture as a Measure of Biodiversity • Traditionally, • agriculture = downgraded ecosystem • a poor relation to the ideal biodiverse ecosystem of "Nature" • Agriculture has its own challenges • Reduced diversity - easily discovered by pests • Monocultures - species, cultivars • Spatial regularity - row crops, crowding • Selection pressure: environment modified by use of pesticides, resistant cultivars, planting date
Wealth of Data • Aside from scientists interested in conservation of genetics of crops & their wild relatives, few agricultural scientists see the value of their data to the biodiversity community • Value in peer-reviewed publications, not data publication • Concern about losing control of their dataset • Biodiversity community has traditionally only paid attention to what is stored in museums or databanks
Land Managers, Climate Change Specialists Need • More than one-off collections of taxa • Sampling biased by collector, but not always apparent • Need measures over time of • Presence and absence • Diversity • Under varying conditions
Agricultural Research has Rich Data Heritage • Purposefully constructed hypotheses tested in • Variety of (controlled) habitats & (uncontrollable) abiotic conditions • Replicated experimental designs • Examine effects of manipulation of the environment on species behavior • Samples taken at uniform intervals over seasons, years
Integrated Pest Management • Sets an economic threshold for making decisions on strategies for maintaining pests at, or below a threshold of economic loss (economic injury level) • The choice of strategies can conserve • Biodiversity • Water, air, & soil quality • money Brewer, et. al. 2009. Opportunities, experiences, and strategies to connect integrated pest management to U.S. Department of Agriculture Conservation programs. American Entomologist 55(3):140-146.
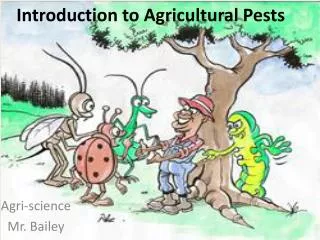
Aphids - Pucerons - Afidos • Direct pests of plants • Vectors of plant viruses • Produce honeydew • Food source for ants, predators, & parasitoids • Molds • Damage to crops depends on when & in what numbers they appear in the field Macrosiphum rosae photo courtesy Alex Wild 2008, http://myrmecos.wordpress.com/ Complex life cycle
Aphids Move • Walking • Intraplant • Interplant • Flying • Intrafield • Interfield • Migration over 100s of kilometers Cartoon by John Sherrod
Bugs = "Angel Echoes" CHILL Radar located in Greeley, Colorado
Tracking Aphids at Elevations Above Ground Level (AGL) • Air temperature • Insects, including aphids accumulate at or in inversions (temperatures are warmer than the air below) • Wind speed • Below jet, aphids local • In jet, had traveled overnight from sources 240-400 km south from overwintering populations
Mapping to Darwin Core • Presence/Absence Observations • Taxon information • Sampling units known volume of air • Large amount of related observations of air temperature, radar observations
Soybean Aphid: Invasive Species in North America • Direct pest of soybean • Suction trap network set up in U.S. Midwest • Prediction of infestation level • Indicator to farmers to scout for signs of aphids http://www.ncipmc.org/traps/index.cfm
Soybean Aphid Central http://www.inhs.illinois.edu/programs/aphids.html#soybeanaphid
Weekly Data • Flights arriving late August built up on late soybean, leaving in September as soybean dried down & flying to Rhamnus
Soybean Aphids Swarm Photo courtesy Alex Wild 2009, http://myrmecos.wordpress.com/
Simple Darwin Core Most agricultural data fit rows/columns Fields used only once No minimum/ maximum data Will include samples with 0 to multiple observations for a taxon Challenges Human observations (not preserved) thus not given an identifier Asked to think about data in unaccustomed ways Asked to document items usually noted once in a field notebook Implications of Darwin Core for Agricultural Data
Example of SimpleDarwinRecord • Easier to use Excel spreadsheet or create a database template to export to Excel
Challenges • Mixture of observations & vouchered specimens • Results buried in literature • Little or no metadata for raw data • Scientists have little incentive to go to extra trouble to share
Conclusions • If we want to incorporate agricultural datasets into our biodiversity assessments, we will need to work with these scientists to make it easy to provide their data in a format that is fit for use by the biodiversity community. Biocontrol in action!Aphis nerii being eaten by a syrphid fly larva. Photo courtesy Alex Wild
How do we do this? • Jim Case provided in talk earlier today, • Bring groups together • Provide introductory guides (documents) • Provide links to resources • Registry system • Discussion forums bring users together • And engage the cooperation of journals to provide a home for data with its metadata
Acknowledgments • Illinois Department of Energy and Natural Resources • Illinois Natural History Survey • Illinois State Water Survey • University of Illinois • North Central Regional IPM • National Science Foundation • Hatch ILLU-370 • Global Biodiversity Information Facility • Biodiversity Information Standards (TDWG)