Download
1 / 17
170 likes | 352 Vues
Global trends in CH 4 and N 2 O. Matt Rigby, Jin Huang, Ron Prinn, Paul Fraser, Peter Simmonds, Ray Langenfelds, Derek Cunnold, Paul Steele, Paul Krummel, Ray Weiss, Simon O’Doherty, Peter Salameh, Ray Wang, Chris Harth, Jens Mühle, Laurie Porter NACP meeting, October 2008. AGAGE network.

E N D
Global trends in CH4 and N2O Matt Rigby, Jin Huang, Ron Prinn, Paul Fraser, Peter Simmonds, Ray Langenfelds, Derek Cunnold, Paul Steele, Paul Krummel, Ray Weiss, Simon O’Doherty, Peter Salameh, Ray Wang, Chris Harth, Jens Mühle, Laurie Porter NACP meeting, October 2008
AGAGE network • Advanced Global Atmospheric Gases Experiment • High frequency (~40 min), high precision measurements • > 40 ozone depleting species and non-CO2 GHGs: • CH4 / N2O / CFCs / HFCs / PFCs / SF6 ... • SIO standards (except methane) • Data available: • agage.eas.gatech.edu • cdiac.ornl.gov/ftp/ale_gage_Agage/ Cunnold et al., In situ measurements of atmospheric methane at GAGE/AGAGE sites during 1985-2000 and resulting source inferences, JGR, 107(D14) p4225, 2008
AGAGE network agage.eas.gatech.edu
Renewed CH4 growth: AGAGE Rigby et al. Renewed Growth of Atmospheric Methane, GRL, in press, 2008
CSIRO flask network • ~4 flasks per month analysed at CSIRO • Independent (but inter-calibrated) network cdiac.ornl.gov
Renewed CH4 growth: CSIRO Rigby et al. Renewed Growth of Atmospheric Methane, GRL, in press, 2008
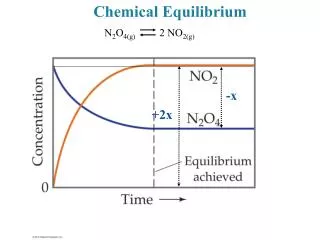
Box model inversion A-priori emission estimates (Cunnoldet al. 2002) Assume 30% error Box model: mixing ratio sensitivity to monthly emission pulses Kalman filter AGAGE/CSIRO CH4 observations Monthly emissions Annual hemispheric running mean
CH4 12-box model inversion • Inter-annually repeating OH • ~ 40Tg/yr increase from 2006 – 2007 (5-6%) • ~ 22Tg /yr NH (5%), ~18Tg/yr SH (10%) Rigby et al. Renewed Growth of Atmospheric Methane, GRL, in press, 2008
OH decrease? • Methyl chloroform inversion: 4±14% OH drop in 2007 • CH4 increase: 20Tg/yr global, 13Tg/yr NH, 7Tg/yr SH Rigby et al. Renewed Growth of Atmospheric Methane, GRL, in press, 2008
Possible CH4 sources • Anomalous high temperatures over Siberia • Increased wetland emission? Permafrost melt?? • No significant CO rise (AGAGE) • Still looking for a SH source… www.ncdc.noaa.gov/oa/climate/research/2007/ann/global.html
Possible reasons for OH decline • Increase in SH column Ozone? • No significant CO rise
N2O latitudinal gradient AGAGE CSIRO GMD/CCGG GMD/HATS + * Huang et al., Estimation of regional emissions of nitrous oxide from 1997 to 2005 using multinetwork measurements, a chemical transport model and an inverse method, JGR, v113 D17313, 2008
N2O flux: MATCH inversion • MATCH: T62 resolution • Kalman filter • 125±24 year strat. lifetime • 12 regions • Global 1997 – 2001: 16.3-1.2+1.5Tg/yr • Global 2002 – 2005: 15.4-1.3+1.7Tg/yr Huang et al., Estimation of regional emissions of nitrous oxide from 1997 to 2005 using multinetwork measurements, a chemical transport model and an inverse method, JGR, v113 D17313, 2008
Conclusions: CH4 • Global growth of methane for first time in a decade • Similar growth rate at all AGAGE/CSIRO stations • Inter-annually repeating OH: • ~ 40TG/yr emissions increase • Substantial contribution from both hemispheres • Inter-annually varying OH: • ~20TG/yr emissions increase • Increase more biased to Northern hemisphere
Conclusions: N2O • Growth continuing at 0.5 – 1 ppbv • MATCH inversion: • 16.3-1.2+1.5 Tg/yr (1997 – 2001) • 15.4-1.3+1.7 Tg/yr (2002 – 2005) • Lower emissions from high latitude SH than GEIA • Higher emissions from NH tropics
Sensitivity to regional sources • Inversion repeated, “fixing” combinations of hemispheres