Module 3: Probability
Module 3: Probability. Introduction to Probability and The Normal Distribution. What is a Probability?. A number between 0 and 1. 1 means it will always happen i.e. “There are only two certain things in life: death and taxes.” 0 means that it will never happen i.e.

Module 3: Probability
E N D
Presentation Transcript
Module 3: Probability Introduction to Probability and The Normal Distribution
What is a Probability? • A number between 0 and 1. • 1 means it will always happen i.e. • “There are only two certain things in life: death and taxes.” • 0 means that it will never happen i.e. • The sun will rise tonight. • ½ means that it will happen about half the time i.e. • A coin will land heads up. • A die will land on an even number.
Notation A Random Experiment or Trial : An experiment where the outcome can not be predicted ahead of time. For example • Parts coming off a production line. • Selection of an invoice in an audit. • Rolling dice. • Spinning a roulette wheel.
The Sample Space Sample Space, S : A list of all possible outcomes of an experiment. For example • There are 38 numbers on a roulette wheel so S = {1,2,3,…,36,000}. • A part coming off a production line is faulty or not so S={Faulty, Not Faulty}. • A coin lands showing either heads or tails, so S={H,T} • A randomly selected invoice is either correct or not so S={Correct, Not Correct}.
An Event An Event : A set of one or more outcomes of a random experiment. In other words a subset of S. For Example • Roulette ball lands on an odd number ({1,3,…,35}). • Part is faulty ({Faulty}). • Invoice is correct ({Correct}).
Naming Events We assign a letter to each event. For example • A={odd number in roulette}={1,3,…,35}. • B={coin lands heads up}={H}. • C={part is faulty}. The probability of A happening is denoted P(A). In this case P(A) should be interpreted as “The probability that the roulette ball lands on an odd number.”
Probability Rules • All probabilities must be between 0 and 1 i.e. for any event A • P(A)=1 means that A will always happen. • P(A)=0 means that A will never happen. • P(A)=0.5 means that A will happen about half the time.
Where Probabilities Come From • Historical observation. • The US stock market has gone up in January 60 of the last 100 years so probability is approximately 0.6. • Classical. • A coin is equally likely to land heads or tails so the probability of a head is 0.5. • Subjective judgement. • Doctor : “You have a 70% chance of living”. • Models. • Normal Distribution.
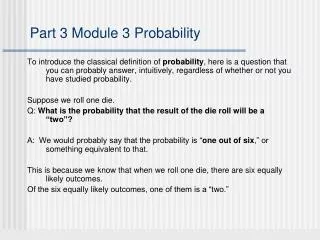
Calculating Probabilities There are many ways to calculate probabilities. For the roulette wheel example probabilities are easy because all outcomes are equally likely. Therefore For example if A={An odd number}, B={H} P(A) = 18/38, P(B) = 1/2.
B A Two Events Occurring Together Using this notation we can talk about P(A and B) which is “The probability that both events A and B happen at the same time.” Or in this case “The probability that the ball lands on an odd number and the coin lands showing heads.
Independence Independence means that knowing one event won’t help you guess another. • If two events are independent then • Multiply their probabilities. • P(A and B) = P(A)P(B) • Example: P(odd number in roulette AND coin shows heads) = (18/38)(1/2) = 9/38. • If two events are dependent (not independent), you need conditional probability, which we’ll learn more about in class.
B B A A Either Event Occurring We can also talk about P(A or B) = P(A) + P(B) - P(A and B) which is “The probability that A happens or B happens or both happen.” In this case it is “The probability that the ball lands on an odd number, or the coin shows heads, or both.”
An Event Either Occurs or it Doesn’t Finally, P(not A) = 1 - P(A) which is “The probability that A does not occur.” In this case it is “The probability that the ball lands on an even number. Not A A
Example • A city has two daily newspapers: the Herald and the Journal. • 35% of the population receives the Herald. • 60% subscribe to the Journal. • 20% subscribe to both. • Randomly choose a person from the city. • H={person subscribes to Herald} • J = {person subscribes to Journal}
Newspapers • Find • P(H and J) (Are H and J independent?) • P(H or J) • P(not H) • P(J and not H)
Random Variables A Random Variable : A variable whose numerical value is determined by the outcome of a random experiment. For example • The value of IBM shares at close of business tomorrow. • The number of defects in one days production. • The number showing when a die is thrown. • The number the roulette ball will land on. We often use X,Y or Z to denote a r.v. e.g. X = price of IBM shares tomorrow.
Events There are fewer than 10 defectives in an order of goods. The Nasdaq will rise tomorrow. Your employees will meet their sales goal next year. Random Variables The number of defective goods in an order. Tomorrow’s Nasdaq closing value. Next year’s sales. Events vs Random Variables
0.40 0.35 0.30 Probability 0.25 0.20 0.15 0.10 0.05 0.00 811 812 813 814 815 816 817 818 819 Population of Shaft Diameters Normal Random Variables • There are many types of random vars. One of the most common is the normal. • The height of the curve indicates likelihood of a normal r.v. falling close to a particular value. • Total area under the curve is 1.
0.80 0.70 Smallstd. deviation Large std. deviation 0.60 0.50 0.40 0.30 0.20 0.10 0.00 -4 -3 -2 -1 0 1 2 3 4 X Same mean Mean and Standard Deviation • All normal r.v.’s have a mean (average value) and a standard deviation (how far from the mean we are on average). • We write • In this picture μ (the mean) is zero and s (the std. deviation) varies.
0.80 0.70 Smallstd. deviation Large std. deviation 0.60 0.50 0.40 0.30 0.20 0.10 0.00 -4 -3 -2 -1 0 1 2 3 4 X Same mean Mean and Standard Deviation • RV’s can be summarized by their mean (average value) and a standard deviation (how far from the mean we are on average). • We write • In this picture μ (the mean) is zero and s (the std. deviation) varies.
Expected Value is another name for the mean of a random variable. “Long run average value” Notation: a and b are known constants X and Y are random variables Expected Value General Rule: E(aX + bY) = aE(X) + bE(Y) Special Cases: E(aX) = aE(X) E(X + Y) = E(X) + E(Y)
Examples: • Two Stocks: • X has an expected return of 10% • Y has an expected return of 15% • 40% of your portfolio is in X and 60% is in Y. • What’s the expected return for your portfolio?
SD: typical amount by which X deviates from E(X). Easy to interpret. Variance is SD2 Nice math rules. Variance and Standard Deviation If X and Y are independent: Var(aX + bY) = a2Var(X) + b2Var(Y) Special Cases: Var(aX) = a2Var(X) Var(X+Y) = Var(X) + Var(Y) Var(X-Y) = Var(X) + Var(Y)
Variance of a Portfolio • Suppose two stocks have returns X and Y which are independent of one another. • Var(X) = 20% • Var(Y) = 30% • Suppose 40% of your portfolio is in X and 60% is in Y. • What is the variance of your portfolio. • Is it plausible to assume independence?
Normal Probabilities • X = the diameter of a randomly produced piston. • The piston must fit inside a cylinder of diameter 3.02 inches. • If X>3.02 the cylinder must be junked. What is the probability that a cylinder will not be junked? i.e. P(X<3.02) • To calculate probabilities for a normal r.v. we • Calculate the Z score. • Look up Z in the “normal tables”.
Step 1 : Z scores • A z score tells how many standard deviations we are from the mean. • Therefore • Hence P(X<3.02) = P(Z<2).
Units • When you do something to a variable, you do the same thing to its unit measure. • Example: • Your mortgage payment is 1,000 dollars per month. • One over your mortgage payment is .001 months per dollar.
Changing Units • Gasoline in England is £1.3/liter. What’s that in dollars per gallon? • One pound sterling is $1.58. • 3.78 liters is one gallon.
Changing Units • A bolt of cloth costs 4 wampum per patch. Convert to dollars per square yard. • 3.28 wampum = $1.63 • 1 patch = 0.3 square yards • My test score was 73. How many standard deviations is that from the mean? • Mean = 85 • Standard Deviation = 6.33
Step 2 : Normal tables • Look up Z=2 on the table. This tells us P(Z<2)=0.9772. • Some more examples • P(Z<1) = 0.8413 • P(Z>1) = 1 - P(Z<1) = 1 - 0.8413 = 0.1587 • P(Z>-1) = P(Z<1) = 0.8413 • P(Z<-1) = P(Z>1) = 1 – P(Z<1) = 0.1587 • P(-1<Z<1) = P(Z<1) – P(Z<-1) = 0.8413 – 0.1587
Practice Problems • Suppose then what is • P(X<4)? • P(X>4)? • P(1<X<4)? • P(X<0)? • Suppose then what is • P(X<50)? • P(-50<X<50)? • P(X<100)?
Example • A company with 5,000 employees has approximately normally distributed salaries. • Mean = $450/wk. • SD = $40/wk. • About how many employees earn less than $400/wk.?