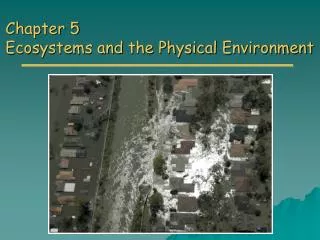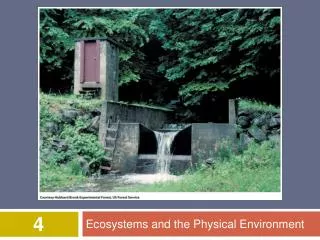
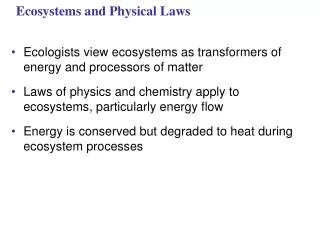
Ecosystems and Physical Laws
Ecosystems and Physical Laws. Ecologists view ecosystems as transformers of energy and processors of matter Laws of physics and chemistry apply to ecosystems, particularly energy flow Energy is conserved but degraded to heat during ecosystem processes. Trophic Relationships.

Ecosystems and Physical Laws
E N D
Presentation Transcript
Ecosystems and Physical Laws • Ecologists view ecosystems as transformers of energy and processors of matter • Laws of physics and chemistry apply to ecosystems, particularly energy flow • Energy is conserved but degraded to heat during ecosystem processes
Trophic Relationships • Energy and nutrients pass from primary producers (autotrophs) to primary consumers (herbivores) and then to secondary consumers (carnivores) • Energy flows through an ecosystem, entering as light and exiting as heat • Nutrients cycle within an ecosystem
Tertiary consumers Microorganisms and other detritivores Secondary consumers Primary consumers Detritus Primary producers Heat Key Chemical cycling Sun Energy flow
Decomposition • Decomposition connects all trophic levels • Detritivores, mainly bacteria and fungi, recycle essential chemical elements by decomposing organic material and returning elements to inorganic reservoirs
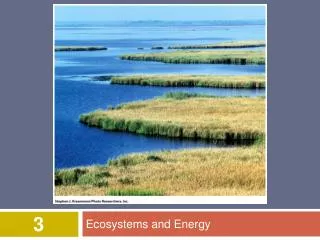
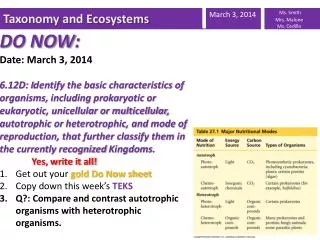
Physical and chemical factors limit primary production in ecosystems • Primary production in an ecosystem is the amount of light energy converted to chemical energy by autotrophs during a given time period • The extent of photosynthetic production sets the spending limit for an ecosystem’s energy budget • The amount of solar radiation reaching the Earth’s surface limits photosynthetic output of ecosystems • Only a small fraction of solar energy actually strikes photosynthetic organisms
Gross and Net Primary Production • Total primary production is known as the ecosystem’s gross primary production (GPP) • Net primary production (NPP) is GPP minus energy used by primary producers for respiration • Only NPP is available to consumers • Ecosystems vary greatly in net primary production and contribution to the total NPP on Earth • Overall, terrestrial ecosystems contribute about two-thirds of global NPP and marine ecosystems contribute about one-third
Open ocean Continental shelf 125 65.0 24.4 360 5.2 5.6 1,500 Estuary Algal beds and reefs 1.2 0.3 0.1 0.1 0.9 2,500 Upwelling zones Extreme desert, rock, sand, ice 0.1 500 4.7 0.04 3.0 Desert and semidesert scrub Tropical rain forest 3.5 90 0.9 22 3.3 2,200 Savanna Cultivated land 2.9 7.9 900 2.7 9.1 600 Boreal forest (taiga) Temperate grassland 2.4 9.6 800 1.8 5.4 600 Woodland and shrubland Tundra 1.7 3.5 700 1.6 140 0.6 Tropical seasonal forest 1.5 7.1 1,600 Temperate deciduous forest Temperate evergreen forest 1,200 4.9 1.3 1,300 3.8 1.0 Swamp and marsh Lake and stream 2.3 2,000 0.4 0.4 0.3 250 20 0 20 50 0 15 40 60 10 10 30 5 25 0 1,000 2,500 500 1,500 2,000 Key Percentage of Earth’s surface area Average net primary production (g/m2/yr) Percentage of Earth’s net primary production Marine Terrestrial Freshwater (on continents)
Light Limitation • Depth of light penetration affects primary production in the photic zone of an ocean or lake
Nutrient Limitation • More than light, nutrients limit primary production in geographic regions of the ocean and in lakes • A limiting nutrient is the element that must be added for production to increase in an area • Nitrogen and phosphorous are typically the nutrients that most often limit marine production • Nutrient enrichment experiments confirmed that nitrogen was limiting phytoplankton growth in an area of the ocean
30 21 Long Island Shinnecock Bay 19 15 5 11 Moriches Bay 4 Great South Bay Atlantic Ocean 2 Coast of Long Island, New York Phytoplankton 8 8 7 7 Inorganic phosphorus 6 6 5 5 Phytoplankton (millions of cells/mL) Inorganic phosphorus (µm atoms/L) 4 4 3 3 2 2 1 1 0 0 30 4 11 15 21 2 19 5 Station number Shinnecock Bay Great South Bay Moriches Bay Phytoplankton biomass and phosphorus concentration 30 Ammonium enriched Phosphate enriched Unenriched control 24 18 Phytoplankton (millions of cells per mL) 12 6 0 Starting algal density 30 4 11 15 2 19 21 5 Station number Phytoplankton response to nutrient enrichment
The addition of large amounts of nutrients to lakes has a wide range of ecological impacts • In some areas, sewage runoff has caused eutrophication of lakes, which can lead to loss of most fish species
Primary Production in Terrestrial and Wetland Ecosystems • In terrestrial and wetland ecosystems, climatic factors such as temperature and moisture affect primary production on a large scale • Actual evapotranspiration can represent the contrast between wet and dry climates • Actual evapotranspiration is the water annually transpired by plants and evaporated from a landscape • It is related to net primary production
300 N + P 250 200 Live, above-ground biomass (g dry wt/m2) N only 150 100 Control P only 50 0 0 August 1980 June July
Energy transfer between trophic levels is usually less than 20% efficient • Secondary production of an ecosystem is the amount of chemical energy in food converted to new biomass during a given period of time • When a caterpillar feeds on a leaf, only about one-sixth of the leaf’s energy is used for secondary production • An organism’s production efficiency is the fraction of energy stored in food that is not used for respiration
Plant material eaten by caterpillar 200 J 67 J Cellular respiration 100 J Feces 33 J Growth (new biomass)
Trophic Efficiency and Ecological Pyramids • Trophic efficiency is the percentage of production transferred from one trophic level to the next • It usually ranges from 5% to 20% • A pyramid of net production represents the loss of energy with each transfer in a food chain
Tertiary consumers 10 J Secondary consumers 100 J Primary consumers 1,000 J Primary producers 10,000 J 1,000,000 J of sunlight
Trophic level Dry weight (g/m2) Tertiary consumers Secondary consumers Primary consumers Primary producers 1.5 11 37 809 Most biomass pyramids show a sharp decrease in biomass at successively higher trophic levels, as illustrated by data from a bog at Silver Springs, Florida.
Trophic level Dry weight (g/m2) 21 4 Primary consumers (zooplankton) Primary producers (phytoplankton) In some aquatic ecosystems, such as the English Channel, a small standing crop of primary producers (phytoplankton) supports a larger standing crop of primary consumers (zooplankton).
Trophic level Number of individual organisms Tertiary consumers Secondary consumers Primary consumers Primary producers 3 354,904 708,624 5,842,424
The green world hypothesis proposes several factors that keep herbivores in check: • Plant defenses • Limited availability of essential nutrients • Abiotic factors • Intraspecific competition • Interspecific interactions
A General Model of Chemical Cycling • Gaseous carbon, oxygen, sulfur, and nitrogen occur in the atmosphere and cycle globally • Less mobile elements such as phosphorus, potassium, and calcium cycle on a more local level • A model of nutrient cycling includes main reservoirs of elements and processes that transfer elements between reservoirs • All elements cycle between organic and inorganic reservoirs
Reservoir a Reservoir b Organic materials available as nutrients Organic materials unavailable as nutrients Fossilization Living organisms, detritus Coal, oil, peat Respiration, decomposition, excretion Assimilation, photosynthesis Burning of fossil fuels Reservoir c Reservoir d Inorganic materials available as nutrients Inorganic materials unavailable as nutrients Weathering, erosion Atmosphere, soil, water Minerals in rocks Formation of sedimentary rock
Biogeochemical Cycles • In studying cycling of water, carbon, nitrogen, and phosphorus, ecologists focus on four factors: 1. Each chemical’s biological importance 2. Forms in which each chemical is available or used by organisms 3. Major reservoirs for each chemical 4. Key processes driving movement of each chemical through its cycle
Transport over land Solar energy Net movement of water vapor by wind Precipitation over land Precipitation over ocean Evaporation from ocean Evapotranspiration from land Percolation through soil Runoff and groundwater
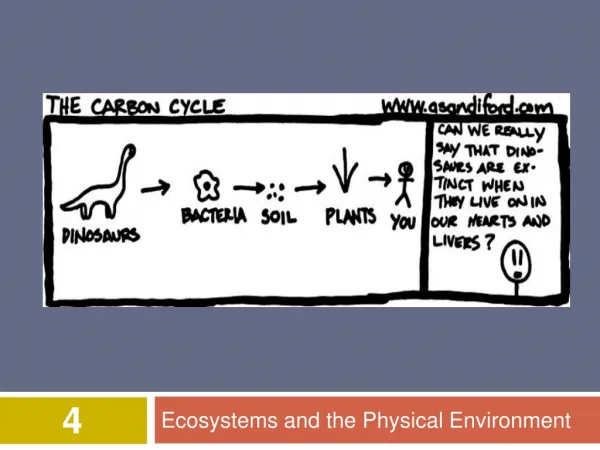
CO2 in atmosphere Photosynthesis Cellular respiration Burning of fossil fuels and wood Higher-level consumers Primary consumers Carbon compounds in water Detritus Decomposition
N2 in atmosphere Assimilation Denitrifying bacteria NO3– Nitrogen-fixing bacteria in root nodules of legumes Decomposers Nitrifying bacteria Ammonification Nitrification NH3 NH4+ NO2– Nitrogen-fixing soil bacteria Nitrifying bacteria
Rain Geologic uplift Weathering of rocks Plants Runoff Consumption Sedimentation Plant uptake of PO43– Soil Leaching Decomposition
Decomposition and Nutrient Cycling Rates • Decomposers (detritivores) play a key role in the general pattern of chemical cycling • Rates at which nutrients cycle in different ecosystems vary greatly, mostly as a result of differing rates of decomposition
Concrete dams and weirs built across streams at the bottom of watersheds enabled researchers to monitor the outflow of water and nutrients from the ecosystem. One watershed was clear cut to study the effects of the loss of vegetation on drainage and nutrient cycling. 80.0 Deforested 60.0 40.0 20.0 Nitrate concentration in runoff (mg/L) Completion of tree cutting 4.0 Control 3.0 2.0 1.0 0 1966 1968 1965 1967 The concentration of nitrate in runoff from the deforested watershed was 60 times greater than in a control (unlogged) watershed.
Agriculture and Nitrogen Cycling • Agriculture removes nutrients from ecosystems that would ordinarily be cycled back into the soil • Nitrogen is the main nutrient lost through agriculture; thus, agriculture greatly impacts the nitrogen cycle • Industrially produced fertilizer is typically used to replace lost nitrogen, but effects on an ecosystem can be harmful
Contamination of Aquatic Ecosystems • Critical load for a nutrient is the amount that plants can absorb without damaging the ecosystem • When excess nutrients are added to an ecosystem, the critical load is exceeded • Remaining nutrients can contaminate groundwater and freshwater and marine ecosystems • Sewage runoff causes cultural eutrophication, excessive algal growth that can greatly harm freshwater ecosystems
Acid Precipitation • Combustion of fossil fuels is the main cause of acid precipitation • North American and European ecosystems downwind from industrial regions have been damaged by rain and snow containing nitric and sulfuric acid
5.0 5.3 5.1 5.4 5.6 5.5 5.2 5.3 6.1 5.2 4.8 5.3 4.7 5.3 4.5 4.6 5.4 5.1 5.5 5.2 5.2 5.2 5.0 4.8 5.2 4.7 4.6 5.2 4.5 4.8 4.9 4.3 5.2 4.5 4.5 5.5 5.5 4.5 5.6 4.7 4.5 5.2 4.6 4.9 5.6 4.5 4.7 5.3 5.4 4.3 5.3 4.4 4.5 5.5 4.6 5.1 4.7 4.6 4.5 4.7 5.4 6.0 4.5 4.4 4.1 4.4 5.3 5.3 4.8 4.4 5.5 4.6 5.9 4.3 4.6 4.6 4.6 5.3 4.5 4.4 5.4 4.5 5.1 4.7 6.3 4.5 4.5 5.0 4.5 5.3 4.7 5.2 4.7 4.6 5.6 5.3 4.8 5.1 4.9 5.4 5.0 5.7 4.6 5.4 4.6 4.8 5.4 4.5 4.6 4.5 5.0 4.9 4.5 4.7 4.8 4.9 4.5 4.6 5.4 4.5 Field pH 5.3 4.7 4.5 4.7 5.0 4.7 4.8 5.7 4.7 5.0 4.8 4.7 5.0 5.3 5.1 5.2 4.7 5.2–5.3 5.1–5.2 5.0–5.1 4.9–5.0 4.8–4.9 4.7–4.8 4.6–4.7 4.5–4.6 4.4–4.5 4.3–4.4 <4.3 4.7 5.0 5.0 5.4 4.7 5.0 4.6 4.7 4.9 5.4 5.1 4.8 4.7 4.8 5.1 5.3 4.8 4.9 4.8 4.7 5.7 4.9 4.8 4.7 5.1 4.7 4.8 5.0 4.7 5.0 4.7 4.9
Toxins in the Environment • Humans release many toxic chemicals, including synthetics previously unknown to nature • In some cases, harmful substances persist for long periods in an ecosystem • One reason toxins are harmful is that they become more concentrated in successive trophic levels • In biological magnification, toxins concentrate at higher trophic levels, where biomass is lower
Herring gull eggs 124 ppm Lake trout 4.83 ppm Concentration of PCBs Smelt 1.04 ppm Zooplankton 0.123 ppm Phytoplankton 0.025 ppm
Chlorine from CFCs interacts with ozone (O3), forming chlorine monoxide (CIO) and oxygen (O2). Chlorine atoms O2 O3 Chlorine CIO O2 Sunlight causes Cl2O2 to break down into O2 and free chlorine atoms. The chlorine atoms can begin the cycle again. CIO Two CIO molecules react, forming chlorine peroxide (Cl2O2). Cl2O2 Sunlight
Animations and Videos • Chapter Quiz Questions – 1 • Chapter Quiz Questions – 2 • An Idealized Energy Pyramid • Energy Flow and The Water Cycle • The Global Hydrological Cycle • The Carbon Cycle • The Global Carbon Cycle • Nitrogen Cycle • The Global Nitrogen Cycle
Animations and Videos • Phosphorus Cycle • Sulfur Cycle • Nitrogen Fixation Animation