Download

1 / 26
260 likes | 409 Vues
Manatees of Florida . Standard:. MAFS.912.S-ID.1.1: Represent data with plots on the real number line (dot plots, histograms, and box plots ). MAFS.912.S-ID.1.3:

E N D
Standard: MAFS.912.S-ID.1.1: • Represent data with plots on the real number line (dot plots, histograms, and box plots). MAFS.912.S-ID.1.3: • Interpret differences in shape, center, and spread in the context of the data sets, accounting for possible effects of extreme data points (outliers).
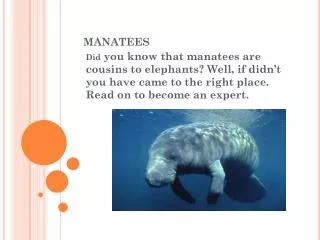
Manatee Facts • The West Indian manatee is a protected species. • Florida has 13 important manatee counties. • Manatees are protected under the Florida Manatee Recovery Plan, which was developed as a result of the Endangered Species Act. • During the winter, manatees stay in the warmer water of Florida. • During the summer months, manatees migrate as far north as the Carolinas and across the Gulf to Texas.
Essential Questions: What are the components that are shown on a box plot? Why is a box plot useful in representing and analyzing data? What are the outliers in each data set as represented in the box plot? What do the outliers represent in relation to the history of Florida’s manatee population? What do the ranges of the different data sets tell us about Florida's manatee population, past, present, and future?
Learning Objectives: • Students will be able to represent data with box plots using a real number line by creating multiple computer generated visual representations and present their representations of data in groups to the class. • Students will be able to represent data with box plots using a real number line through two modes of visual representation on Geogebra. • Students will read and interpret the data in a box plot and identify the components of the plot. • The student will be able to compare two related box plots and analyze their differences. • Based on the data, students will be able to make predictions about future populations of Florida manatees.
Prior Knowledge • Students will have a basic understanding of histograms, dot plots, and box plots. • Students will need to know how to formulate mean and median. • Students should know how to formulate outliers. • Students should have a basic understanding of Microsoft Excel and Geogebra. • Students should know how to cut and paste data. • Students should know how to access their student county portal and have access to their own email accounts. • Students will need to know how to use their email accounts and be able to upload and send documents. • Students should be familiar with teacher's email, website, or Edmodoaccounta and know how to upload documents to those accounts.
Identifying Outliers http://xkcd.com/539/ A data value is an outlier if it is either: Less than Q1-1.5(IQR) More than Q3+1.5(IQR) IQR = Interquartile Range Q1= First Quartile Q3 = Third Quartile
Guided Practice: • Manatee Data has been uploaded to my (insert your site name here) • Download and save data in a Microsoft Excel Spreadsheet Manatee Data.xlsx • Open Geogebra. • Copy all cell fields A1 to D29 in MS Excel to the Geogebra spreadsheet. • Create a One Variable Analysis using Column D only. Make sure that you include the title in chart option. • Select the box plot and display statistics.
Answer the following questions in your Math Journal: • What are the min and max values of the box plot? • What is the IQR (interquartile range) and how is different that the range of the complete 28 data points? • What is the median? Q1? Q3? • Are there any outliers and what do they indicate? • What conclusion can be made about the manatee population in Florida?
Submitting Your Assignment • Copy your box plot to Graphics View before saving and submitting your work. ****Geogebra will not automatically save the Plot Box with the data. It must be copied to the Graphics View so that it becomes part of the original worksheet. 2. Save your data using the following format before submitting: • Lastname.Firstname.Periodnumber.practice • Ex., Hendricks.Cynthia.4.practice 3. Upload your Geogebraworkfile to (insert your site information here).
Students must be able to download the data set shown. • Teachers will upload the data set to their teacher portal, webpage, or cloud accounts for student retrieval. They may also email data set to their students. Students will open the data set with Microsoft Excel and then copy and paste the data set into Geogebra. • Data is from Florida Fish and Wildlife Conservation Commission: Manatee Synoptic Surveys. • http://myfwc.com/research/manatee/projects/population-monitoring/synoptic-surveys/
Once the data set has been copied into Geogebra, students will need to check their data points for accuracy. Students will need to select Column D and run a One Variable Analysis on the selected data set.
Students will need to select the cog and choose: Use Header as Title. Students will then click - Analyze
The analysis will generate a histogram. Students will need to select the chart box and drag down to select Boxplot to change the graph.
Students will need to select the Show Statistics Icon to display statistical data for the box plot.
Students will need to Right Click in the box plot and select Copy to Graphics View in order to save the box plot with the data.
Independent Practice • Open your manatee population data in your Geogebra file. • Select all of the data in columns B and C and then click on the Multiple Variable Analysis icon above the data. • Select the Cog and click on Use Header as Title. • Select the Statistics icon to show statistical data. • Right click in the plot box and select Copy to Graphics View. • Save Data using the following format before submitting: • Lastname.Firstname.Periodnumber.manatee ex., Hendricks.Cynthia.4.manatee • Submit file to teacher the same way that the Guided Practice was submitted.
Answer the following in your MATH JOURNALS: • Compare the east versus west manatee populations on the box plots. • Make 3 conclusions based on the data. • What are the min and max values of the box plot? • What is the IQR (interquartile range) and how is it different from the range of the complete 28 data points? • What is the median? Q1? Q3? • Are there any outliers and how what do they indicate? • What conclusion can be made about the manatee population in Florida?
Students will need to choose all Data in Columns B and C and then select the Multiple Variable Analysis Icon above the data.
Formative Assessment • Formative Assessment will occur during the teacher phase, guided practice, and independent practice. • The teacher will walk around and interact with each students during independent and guided practice. • The teacher will make sure that students are using Excel and Geogebra effectively and accurately. • The teacher will ensure that all students are able to save and upload their files to teacher’s site (Edmodo, website, email, or print data).
Feedback to Students: • Students will be given feedback as the open class discussion targets the Essential Questions, Objectives, Vocabulary, and background knowledge needed for this lesson. • Students will receive feedback as they work in their groups to complete their Check For Understanding Formative Assessment. • Students will continue to receive feedback as they work to input data, create visual representations, and upload data to the teacher's online educator's site or email.
Resources: • http://www.savethemanatee.org/manfcts.htm