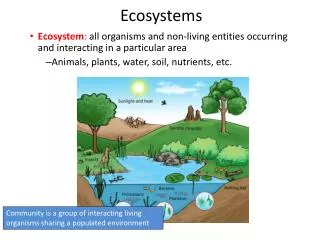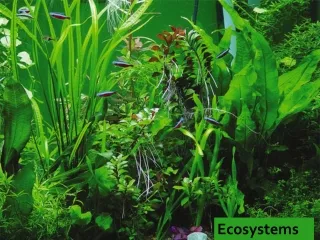
Measuring ecosystems
Measuring ecosystems. Experiment 1 - Surveying. You will make an accurate to scale drawing of the ecosystem we are going to study. The drawing will need to have accurate measurements (+/- 01m) to show key distances.

Measuring ecosystems
E N D
Presentation Transcript
Experiment 1 - Surveying • You will make an accurate to scale drawing of the ecosystem we are going to study. • The drawing will need to have accurate measurements (+/- 01m) to show key distances. • You will need to record the accurate positions of the 8 key (identified by your teacher) trees.
Make a plan….. Now using your plan go and measure what you think will be needed to produce your plan. Then using your measurements and a relevant method (electronic or by hand) make your accurate drawing.
Experiment 2 Measuring trees For each of the 8 key trees we will measure: • The trunk diameter, • The average crown diameter, • The tree height. You will need to record your data using a relevant method. Don’t forget units!
Measuring trunk diameter • Diameter of a tree gives an indication of its age. • C = π D or • D = C/π C D
Measuring tree height • H = tree height • L = distance from the tree you measured the angle (α) at (in meters). • H = h1 + h2 • h1 is your eye height (in meters) • h2 = L x tan(α) (α)
Experiment 3 – measuring canopy The measurements for the canopy in all 4 directions North, East, South and West gives you an ability to estimate the approximate ground area the tree covers and so an ability approximate the solar energy absorbed by the tree. South North
Tree calculations and presentation of data. • To present your processed the data: On the initial survey you completed you need to record the tree’s ‘vital statistics’ and the canopy as a scaled ‘kite diagram’ positioned where the tree was. E.g.: D = Trunk diameter at 1m from the ground H = tree height N E W D = 0.15m H= 8.5m S
Experiment 3.- Measuring Biodiversity SIMPSON’S DIVERSITY INDEX To calculate Simpson's Index for a particular area, the area must first be sampled. The number of individuals of each species present in the samples must be noted. For example, the diversity of the ground flora in a woodland, might be tested by sampling random quadrats. The number of plant species within each quadrat, as well as the number of individuals of each species is noted. There is no necessity to be able to identify all the species, provided they can be distinguished from each other. • Diversity is a measure of – a) the no. of different species and b) the evenness each species To work out SBI we will need to measure: N = total no. of all species n = no of individuals of a particular species High value of D = diverse ecosystem /stable, low value = not diverse ecosystem / unstable
N = N- 1 = N(N-1) = ∑ n(n-1) = D = 15 Lets do a bit of practice….. 14 210 2+56+0+0+6 =64 3.28 Now work out the SBI for the pond….
Your task……. • Compare the SBI for a 2 different flowerbed or grass areas and compare them. (one of the flower bed areas must be the one in the corner nearest administration!) • Points to consider: • you have to compare the same area to make it a fair test. • Do not destroy or trample any of the beautifully cared for plants in your efforts
Experiment 4 – Soil analysis • Soil has many of the abiotic factors that will affect plant growth from pH to nitrate and water availability. It also has a major function in nutrient cycling and is a major store for organic matter. This experiment will show you ways to measure all of this. Organic zone Elluvial zone Illuvial zone Bed rock
Using the soil test kits…. • The soil test kits allow you to test for: • Soil pH • Potassium (K) • Phosphorus (P) • Nitrate Use the ‘Soil Auger’ to get your small sample and follow instructions in the pack to measure your nutrient contents.
Measuring water, organic and mineral contents - method • Take a 250ml beaker, weigh it, record this value. • Half fill the beaker with soil, weigh it, record this value. • Heat the beaker over a bunsen burner for 10 minutes to dry it (stirring occasionally), leave it to cool, weigh it, record this value. • Pour the soil onto a metal tray and spread it out. Using a bunsen burner very carefully apply the flame directly to the soil – it will glow red hot, (this will burn off the organic matter) Leave it to cool. Carefully (so as not to lose any soil) put the soil back in the beaker and reweigh it, record this value.
Measuring water, organic and mineral contents - data Record the data in a suitable format. From the data you have recorded work out: • The original mass of the soil, • The mass of water lost from the soil with the first heating, • The mass of organic matter lost from the soil by the second burning, • The inorganic matter left behind after all else is removed. Decide on a suitable way to present this data graphically – hint - the original mass of the soil would be 100% of the soil and everything else would be a proportion of that original mass.
Each of the 4 experiments will be assessed using the following rubric