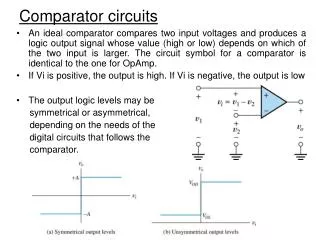
Evaluation of Comparator Performance Under Radiation: Insights from PSI Testing
This report provides a comprehensive analysis of the performance of comparators LM339D, LP339M, and LM139 when subjected to radiation conditions at PSI. Key evaluations include input bias current, output drift, gain, and response time across various dose levels. Testing was conducted under proton energy of 230 MeV at a dose rate of 7.5 rad/s. Results indicate observable output degradation but no single event transients (SETs) exceeding thresholds were recorded. Implications for device reliability and application dependability are discussed.


Evaluation of Comparator Performance Under Radiation: Insights from PSI Testing
E N D
Presentation Transcript
PSI tests - Comparator Results • Devices under test and beam conditions • Schematics • Results • Input bias current • Output drift • I-V acquisition of the comparator outputs • Gain • Response time • SET
Devices under test and beam conditions • DUT • LM339D, LP339M and LM139: • SET • LM339D and LP339M • Input biasmeasurements • LM339D: • Output drift • I-V acquisition of the comparator outputs • Gain • Response time • Beam conditions: • PIF facility at PSI • Proton energy was set to 230 MeV • Dose rate : 7.5 rad/s (270 Gy/h)
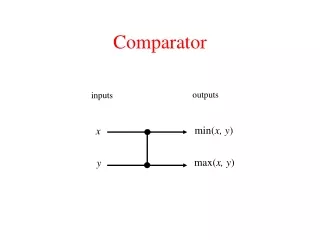
Schematics SET evaluation • From literature, the lowest ΔVin gives the highest chance to get SETs
Schematics Input bias current
Schematics Output drift / Response time / Gain / I-V measurements • 4 kinds of measurements performed: • Output drift by applying a constant V(-) during irradiation • During test breaks: • Gain by applying a saw tooth at V(-) • Response time by supplying V(-) with a square wave • I-V curves by using a Source Measure Unit (Keithley)
Input Bias Current • LM339D • Vin > 0 • V(-) = 7.5V • I(+) = 75 nA → V(+) = 7.5 V • 1st Run • Up to 80 Gy • At 80 Gy run was stopped • Change supply voltage from: • +/- 15V to 0/34V
Input Bias Current • 2nd Run • Vin > 0 • V(-) = 17V • I(+) = 170 nA → V(+) = 17 V • At ≈ 155 Gy → I(+)max is exceeded (250 nA)
Input Bias Current • LP339M • At ≈ 57 Gy → I(+)max is exceeded (25 nA)
Output Drift • Voutinit set to –Vcc (-15V) • Test break : • Othermeasurements (Gain etc…) • Trend of the Vout variation vs dose: • Vout tends to lower values • From 0 to 300Gy: • Voutdriftedfrom: • -14.927 V to -14.895 V (32 mV) • LM339D • Can be assumed as very small • Datasheet affords no information concerning the allowed drift
I-V measurements of the comparator outputs • LM339D • Test break : • I-V measurements • Source-Measure Unit (Keithley) • Inject I and measureVout
I-V measurements of the comparator outputs • A trend of the output is observable: • I-V curves → Lower values of Ic vs Dose • LM339D Breakdown • Reasons: • β (output transistor) decreased • Current source isdamaged Active field of the transistor
Gain • Test break : • V(-) → SawtoothwaveformΔV = 10mV • V(+) → Ground
Gain • Specifications: • Gainmin = 50V/mV • Gain of the 2 irradiatedcomparatorsdecrease vs dose • Variation of the reference Gainis due to the limitedresolution of the scope to measure Vin. • The increase of Vin is due to the input offset • As dose increases, ΔVin increases to change the output state • → Lowresolutionisless dominant • Switching voltage increases with dose.
Response time • A step from -100mV to +100mV was applied on V(-). • Results show that response time increases vs dose with respect to the reference: • Rising time can be acceptable depending on the application • 50% after a TID of 150 Gy (from 2.1 µs to 3 µs) • 220% after a TID of 300Gy (from 2.1 µs to 4.75 µs)
Summary of the Results • The analysed parameters show a degradation. In some cases the datasheet limit is exceeded
Conclusions • No SET (>15 ns and > 100 mV) have been observed for any of the DUTs. • The analysed parameters show a degradation • In some cases the datasheet limit is exceeded as shown in the previous table • The degradation can be tolerated depending on the application