Download

1 / 38
470 likes | 2.33k Vues
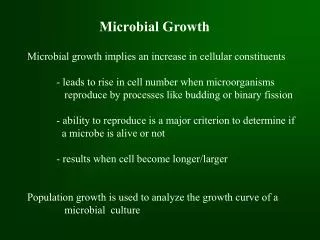
I. Microbial growth II. Environmental effects on microbial growth. I. Microbial growth. A. Exponential growth and how to calculate it B. Growth curve of bacteria in culture C. Measuring cell growth D. Continuous culture. I. Microbial growth. A. Exponential growth and how to calculate it.

E N D
I. Microbial growthII. Environmental effects on microbial growth
I. Microbial growth • A. Exponential growth and how to calculate it • B. Growth curve of bacteria in culture • C. Measuring cell growth • D. Continuous culture
I. Microbial growth • A. Exponential growth and how to calculate it
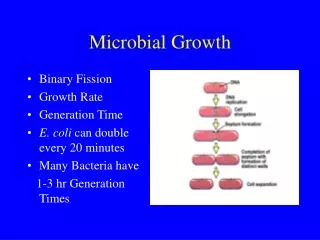
Generation time • Generation time (g) (or Doubling time) -- the time required for a population of cells to ___________. Or: the time required for one cell to become ______. • For this example, g = • ___________
Estimating generation times ___ hr
Calculating generation times (g) = 20 Notice the simple “geometric” progression of the number 2 = 21 = 22 = 23 = 24 = 25 = 26 = 26 = 27 = 28 = 29 = 210 = 211 = 212
Calculating generation times (cont.) • Because of this geometric progression, there is a direct, predictable relationship between the number of cells in a culture ________ and the number there ___________ a period of exponential growth: • Nf = • Where: Nf is the ________ cell number • Ni is the_________ number of cells • n is the _______________________
Nf = (Ni)2n So, if we start with 20 Salmonella cells in a potato salad sitting on your warm kitchen counter, with a 30 minute generation time, how many cells will there be after 8 hours? To get the # of generations (n), divide 8 hours by 30 minutes to get 16: Nf = (20)2 ___ Nf = (20)(_______) = 1,310,720 cells Calculating generation times (cont.)
Why haven’t bacteria, then, grown to fill the entire earth? Why aren’t we knee deep in them? Answer: eventually something _________ their __________. Such as? --lack of __________, build up of ___________, environmental conditions, predation, etc. A single bacterium with a generation time of 20 minutes would, growing exponentially for 48 hours, produce a population weighing approx. 4000 times the weight of the earth! (And a single bacterium weighs approx. one-trillionth of a gram)
Text Fig. 7.17 _____ phase -- period after inoculation of a culture before growth begins. Exponential phase -- period of exponential growth _______________ phase -- period in which growth ceases Death phase -- period in which cells die off
How do we measure growth? • Total cells count (or “direct microscopic counts” or just “_________ ___________”) • Viable counts (also called “___________ ____________” or “colony counts”) • Measurements of cell mass and _____________
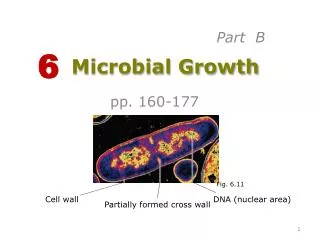
a.k.a “direct counts”, “total cells counts” Text Fig. 7.16
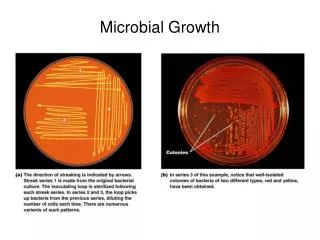
Sample pipetted into sterile plate Sterile medium added and mixed well with inoculum Incubation Typical results Viable count Sample pipetted onto agar surface Sample spread evenly over surface Incubation _______ plate method Typical results _________ plate method
Measurements of cell mass and turbidity • 1. Measuring ________ __________ : centrifuge organisms and _________ them (usually dried). • Cell mass is proportional to cell number • 2. Measuring ________________ : measure cloudiness of a cell suspension by light scattering. • Turbidity is proportional to cell number, also
1 2 Typical growth curve data (obtained in Klett units) for two organisms growing at different growth rates
Cell number or dry weight and turbidity are ___________________ • In other words, once you know one, you can figure out the other if you know their relationship
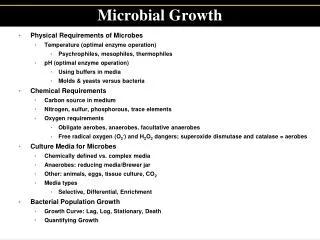
Effect of environmental factors on microorganisms • 1) Important to distinguish between effects on _____________ (whether the cells survive) and effects on ____________ (including reproduction). • 2) Important factors: • _____________ • _____________ • _________ availability • oxygen
Text Fig. 7.16 Effect of temperature on growth rate • Each microorganism has a minimum, maximum, and ___________ • Organisms can be classified by temperature
Boulder Spring, a boiling spring in Yellowstone National Park
Growth of thermophilic cyanobacteria in Grand Prismatic Spring, Yellowstone
Photomicrograph of a bacterial _________________ which developed on a microscope slide immersed in a boiling spring
RESEARCHERS DISCOVER EVIDENCE OF MICROSCOPIC LIFE AT THE SOUTH POLE • July 6, 2000 • In a finding that may extend the known limits of life on Earth, researchers have discovered evidence that microbes may be able to survive the heavy doses of ultraviolet radiation and the extreme cold and darkness of the South Pole. • The team's findings, published in Applied and Environmental Microbiology, the journal of the American Society for Microbiology, indicate that a population of active bacteria, some of which have DNA sequences that align closely with species in the genus Deinococcus, exists at the South Pole in the austral summer. A similar species lives elsewhere in Antarctica, but the discovery of microbes at the Pole may mean that the bacteria have become uniquely adapted to the extreme conditions there, including a scarcity of liquid water. • A species in the genus Deinococcus was first discovered in cans of irradiated meat in the 1950's, and is able to withstand extreme dryness and large doses of radiation. It is possible that the related bacteria from the South Pole may also possess these characteristics. • "While we expected to find some bacteria in the South Pole snow, we were surprised that they were metabolically active and synthesizing DNA and protein at local ambient temperatures of -12 to -17 Celsius (10.4 to 1.4 degrees Fahrenheit)," said Edward J. Carpenter, of the State University of New York at Stony Brook.
Effects of pH ________________ Cytoplasmic pH _______________
Effects of salt (sodium ion concentration) on _________ ___________ of various microorganisms
Method for testing a microbial culture for the presence of ____________