BLACK SEA OUTLOOK
180 likes | 385 Vues
BLACK SEA OUTLOOK. 3rd Bi-annual BS Scientific and UP-GRADE BS-SCENE EC Project Joint Conference. http://www.esimo.ru. NEW APPROACHES TO DEVELOPMENT OF WEB-PORTALS BY THE EXAMPLE OF THE BLACK SEA PORTAL. Evgeny D. Vyazilov ( vjaz@meteo.ru ) , Nicolay N. Mikhailov ( nodc@meteo.ru ) ,

BLACK SEA OUTLOOK
E N D
Presentation Transcript
BLACK SEA OUTLOOK 3rd Bi-annual BS Scientific and UP-GRADE BS-SCENE EC Project Joint Conference http://www.esimo.ru NEW APPROACHES TO DEVELOPMENT OF WEB-PORTALS BY THE EXAMPLE OF THE BLACK SEA PORTAL Evgeny D. Vyazilov (vjaz@meteo.ru), Nicolay N. Mikhailov (nodc@meteo.ru), Denis A. Melnikov (melnikov@meteo.ru) All-Russian Research Institute of Hydrometeorological Information – World Data Centre 6, Korolyov Str., 249035, Obninsk, Kaluga Region, Russia
The problems of web-sites and web-portals • Many sites have been developed in the form of static pages yet, small using of the CMS for remote enter of dataand metadata • The web-sites are developing, as rule, for narrow thematic fields • The wide variety and insufficient standardizationof applications interface, especiallyof output forms for applications • The low level of automation of data processing – no monitoringof different steps of dataprocessing • High complication of management and exchange the heterogeneous data • A sites and portalsout put very big data, as results - a users can not reactvery quickly on permanent change of environment • Absent aautomatic tolls of anomalyparametersindication for assessments of conditionsenvironment • Increasing of different devises, which have a access to Internet (iPhone, iPad, Smartphone, Communicator) – the pages with map have the errors
For examples of modern decisions for portal structure iGoogle(http://www.google.ru/ig?rls=ig&hl=ru&source=iglk) iPhone iGoogleallow: • to add/delete, createa widgets • to move awidgetson screen • to edita getting upportal • to edit web-pages (to create one/two/threecolumns),theirwidth iPad
New approaches • - Use of integrated data from the systems of distributed data bases • - Presentation of main functional capabilities on a single page • - Component-based approach to software development – every component is independent application • - Setting up and location in a any place on the screen of software components • - Using of a slider to review software components in a single window • - Using of standardization of data exchange formats - RSS, GeoRSS, vCard • - Adaptation of each software component to user information needs and new tasks (setting on content – geo region, time period, DB, etc.) • - Using of portlets (JSR-286 standard and WSRP standard), web-services - SOA standards (UDDI, WSDL, SOAP) and map services (WMS, WFS) • - Using of system for automatic monitoring of resources and services (Tivoli) • Development of system for logging of error situations of every component • The unified system of user authentication and authorization on the base JOSSO (Java Open Single Sign-On) or different same systems
Development of approachesfor data integration • The using SOA, ISO andOGC standards, web-technologies and GIS • Interaction model of software components – standard interfaces of interoperability • Unified point for inputin resourceson base of access politicto data • The development of infrastructure for portals Mirror of main portal (Moscow) The main portal (Obninsk) North-west region, Far East Seas, etc. The regional portals For ice data, marine activities The thematic portals The distributed data sources • The users functions (data search, push, personalization of content, etc) • Integration applications: GIS, analytical system, models and others for processing and visualization of information
Schema of portals on the base integrated data Regional Portals Emergency Portal Portal Data Exchange with IS Ice Portal Portal: General using Forecast Portal
Portal– General functions The main page Authorization Race line – information on storms, tsunami, ice, etc. About portal News of media Events International systems Real-time data Forecast data Climatic data News of portal Analytical presentations Catalogue of object files Interactivemap Metadata search Resources of World ocean Marine transport, ports Historical data Slider Technological services Administrativepart …….. Personal pages Menu for applications (show all applications for net or list). Every application have picture, the tools of personal funning for content
Functions for informativesecuring • Metadata: • Metadata search : data sets, organizations, projects, formats, methods, observing platforms (RVs, voluntary ships, coastal stations, satellites, buys), software, cruises, scientists, legal documents • Navigation on metadata – data search from any object metadata • Generation of news and analytical digest, reports (aggregated information for metadata), etc • Data: • Full text and attributing searchof data • Visualization of data on the map and table and storage of results on user PC • Output of information in type the updating pages • Applications: • Development ofpersonal pages (work stations) of users • Realization of application tasks for complex processing and using in marine activity • Data push to a information systems of different agenciesfor direct using
The scheme of integrated resources using The base of integrated data (BID) A sources of distributed data IS for Mintrans BID SOI RIHMI BID IS for EMERCOM Application tasks SIO Resources description Integration server BID Application AARI Analytic tasks BID Portal GMC Work station BID GIS FTP, e-mail IS, application • Funning of delivery byschedule (resources, time, delivery point) • Direct accessin distributed data resources by links • Data push inASCII, NetCDF, XML formats • Data using in application tasks
Analytical software • Types of visualizations (table, text, graphic, diagram, map, “equipment”, media) • The search of indexes • The preparation of presentations, materials for reports • The development of infographic (joint on one presentation of several types of dynamic information, links) • Including of analytical presentations to different web-sites, portals
GIS – visualization • Creation of spatial data – basic layers(depth, coastal line, countries, etc), static and dynamic layers for oceanographic parameters • Using of interactive mapfor receiving a analytic information • Using of geoservices (WMS, WFS) indifferent applications • Using of tolls for measuring of length, area, receiving of aggregated data for any region
Interactivemodeling of processand analysesof situations 2 The results of interactive modeling 1 The enter of a initial data for modeling of oil spills 3.The analysis and decision making • The creation of jointed web-services for call software components • Input of parameters of modeling • Data delivery to using application point • Modeling of situation and transfer of results • Visualization and geo analysis of modeling results
The preparation and visualization of analytical presentations Map Diagram The search of indicators Table • The creation of data sets (time series, gridetc.) for applied task • Data preprocessingand и calculating of indexes • Usingof situationindicators (for example, max wind velocity – 15 m/s, wave high – 5 m) • Visualization (map, diagram, text, table),data storage anddynamic update • Distribution of analytical presentations
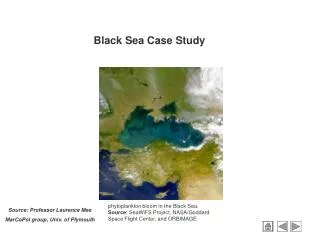
Portal «Black Sea» (http://80.245.248.214/portal/portal/blacksea/) • Functions: • - Search of information resources; • - Visualization on the interactive map of observed, analyzed, forecasted and climate data for one or several regions (satellite data on clouds and water temperature); • Observed and climate data on air temperature, pressure, precipitation, etc.); • Specific layers with operational information on coastal stations, hazardous events; • - Visualization of news, regulatory documents, electronic atlas, containing climate summaries, analyses of coastal zone pollution, socio-economic data; • -Oil spills assessment.
Portal «Russian seas» http://80.245.248.214/portal/auth/portal/rgm) • Content: • - Russian seas • Storm massages • Data on storm (wind and wave) • Tsunami • Real-time data • Temperature of water • Ice conditions • Pollution • Forest fires
Conclusion • Developed the new approaches for portal creation • Prepared the software components (GIS, Analytic application, portlets) • Created the distributed data base, including 29 partners, 1900 information resources nearly 2 Tbytes (daily update 4-6 Gbytes) • We have several variants portals (Black Sea, Russian Seas, North-west region, Far-east region)
http://www.esimo.ru, http://80.245.248.214/portal/portal/blacksea Thank you for attention