Download
1 / 36
360 likes | 384 Vues
This study explores the use of polar satellite data in regional modeling and describes new applications for studying weather and climate in polar regions. The focus is on assimilating radiance data to improve simulations of surface energy balance and cloud properties.

E N D
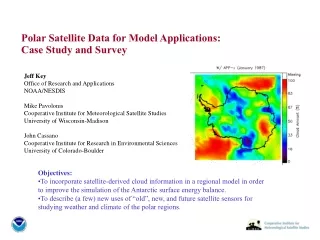
Polar Satellite Data for Model Applications:Case Study and Survey Jeff Key Office of Research and Applications NOAA/NESDIS Mike Pavolonis Cooperative Institute for Meteorological Satellite Studies University of Wisconsin-Madison John Cassano Cooperative Institute for Research in Environmental Sciences University of Colorado-Boulder • Objectives: • To incorporate satellite-derived cloud information in a regional model in order to improve the simulation of the Antarctic surface energy balance. • To describe (a few) new uses of “old”, new, and future satellite sensors for studying weather and climate of the polar regions.
Sounder clear radiances, including microwave (but not over land yet) • Geostationary imager winds (low- and mid-latitude) • Geostationary sounder total precipitable water over land • Geostationary clear sky imager radiances (new) • Geostationary cloud top pressure (new) • Scatterometer sea surface winds • Passive microwave precipitation (?) • MODIS polar winds (new) • Note that: • The emphasis is on assimilating radiances, not higher level parameters • Cloudy sky information is, for the most part, absent. This is a result of the need for fast, cloudy sky radiative transfer models. Current Use of Satellite Data in NWP Models
Extended AVHRR Polar Pathfinder (APP-x), 1982-99 Cloud Forcing, Autumn
Recent Trends (Courtesy R. Stone)
Winter Surface Temperature Trend: APP-x TOVS Path-P (Courtesy J. Francis)
Heat and Moisture Advection from TOVS Path-P Decadal trends in poleward advective heating in layer between 500 and 300 hPa (K/day/decade) for each season. (Courtesy J. Francis)
An application to the Antarctic surface energy balance… • Purpose: • Cloud properties from the newly extended AVHRR (Advanced Very High Resolution Radiometer) Polar Pathfinder (APP-x) data set were incorporated into the Arctic Region Climate System Model (ARCSyM) in order to improve the simulation of the Antarctic surface energy balance. • Data: • Extended AVHRR Polar Pathfinder (APP-x) • 1982-99 • Cloud properties (amount, thermodynamic phase, optical depth, particle size, height) • Twice-daily, 25 km (subsampled from 5 km pixels, not averaged) • ECMWF grids to initialize and force the model at the boundaries • SMMR and SSM/I sea ice concentration
Methods: The APP-x data were converted from 25 km to 200 km to match the ARCSyM grid. The cloud fraction in each grid cell determined where water vapor would be added or subtracted. If the cloud fraction for a specific grid cell was 50% or greater, then that grid cell was taken to be cloudy. Vertical cloud extent was determined by the APP-x cloud properties. All vertical sigma levels within the cloud were flagged so that water vapor would be added to those levels, if a cloud was not already present in the model. Enough water vapor was added so that the relative humidity was 101%. If a cloud was present in a model grid cell that should be clear according to the satellite data, then water vapor was subtracted so that the relative humidity was 80%. All model integrations were 48 hours. A model “spin-up” was allowed for by discarding the first 24 hours of output and keeping only the second 24 hours of output. Model experiments with and without the APP-x data were performed for the year 1987.
The 200 km horizontal ARCSyM domain used in all experiments in the Antarctic.
Results Spatial and temporal distribution of mean monthly cloud amount (%) from ARCSyM experiments that incorporate the APP-x data in the Antarctic. Spatial distribution of cloud amount for January 1987 for experiments that incorporate the APP-x data.
Results, cont. Spatial and temporal distribution of the difference in mean monthly cloud amount (%). The data is expressed as results with the APP-x data minus results without the APP-x data. Cloud amount differences for the month of January. Modeled summertime cloud amount is significantly lower than satellite amount.
Results, cont. Spatial and temporal distribution of the difference in the mean monthly downwelling longwave flux (W m-2) at the surface . The data is expressed as results with the APP-x data minus results without the APP-x data. Downwelling longwave flux differences for the month of January. Modeled summertime longwave down is lower than satellite-derived.
Validation Comparison of the downwelling longwave radiative flux at the surface during 1987 from both model experiments, the NCEP-NCAR reanalysis, and South Pole Station measurements. Shortwave radiative flux absorbed by the surface. Summertime differences are greatest
Validation, cont. Comparison of the upwelling longwave radiative flux at the surface during 1987 from both model experiments, the NCEP-NCAR reanalysis, and South Pole Station measurements. Differences are small, which may suggest that model integration time is too short for the surface to respond to increased downwelling longwave radiation. Note that NCEP values are much closer to “truth” than for the downwelling LW flux.
Validation, cont. Comparison of sensible heat flux at the surface from both model experiments, the NCEP-NCAR reanalysis and the average sensible heat flux estimated from automated weather station data on the Ross Ice Shelf by Stearns and Weidner (1993). Latent heat flux at the surface.
When the cloud fields in the ARCSyM were altered using information from the APP-x data set, significant improvements in the monthly mean downwelling longwave radiation at the surface were observed. In the austral summer, improvements as large as 30 Wm-2 at the South Pole, compared to the baseline results without satellite data, were seen. The underestimate of cloud amount by ARCSyM may be related to integration time: the longer the integration time (e.g., 1 month rather than 48 hours), the greater the modeled cloud amount. However, only a small improvement was seen in the turbulent heat fluxes and surface temperature. This is probably because the model integration time of 48 hours was not long enough to allow the air and surface temperature to respond appreciably to large changes in the downwelling longwave radiation. A 10-year data set with radiative and turbulent fluxes is available at http://stratus.ssec.wisc.edu. This work will be published in Monthly Weather Review (Pavolonis et al., in press). Summary of Antarctic Study
AMSR-E New Instruments
MODIS winds are generated in real-time; AVHRR GAC winds are generated in near real-time (shown as a daily composite below). Both are available at http://stratus.ssec.wisc.edu/products/rtpolarwinds. Real-Time Winds from MODIS and AVHRR MODIS AVHRR
Error Propagation to the Midlatitudes: Snowfall Accumulated snowfall forecasts (mm water equivalent) over Alaska for 20 March 2001. Inclusion of MODIS winds in the analysis can produce a more accurate forecast. At right is the snowfall from the 5-day Control forecast (no MODIS winds); below left is the snowfall from the 5-day forecast that included the MODIS winds in the analysis; below right is the snowfall from a 12-hr forecast for verification (“truth”).
Winds from Sounders Error statistics for comparisons of satellite-derived wind profiles (with mass conservation correction of Zou and Van Woert (2000)) with rawinsonde measurements during SHEBA. Blue lines are biases, red lines are RMS errors, and green lines are rank correlation coefficients. (Courtesy C.-Z. Zou)
Monthly Mean Temperature Inversion Characteristics from MODIS Strength (C) Depth (m) January July
Eight-day Composite MODIS Climate-Modeling Grid (CMG) Snow Map at 0.05° resolution (Courtesy D. Hall)
MODIS Ice Surface Temperature (IST) Near the tip of the Antarctic Peninsula, April 16, 2002 (fall) MOD02HKM MOD29 IST (Courtesy D. Hall)
Atmospheric Infrared Sounder (AIRS), using GOES as an example 100 Advanced Sounder (3074) GOES (18) Pressure (hPa) Pressure (hPa) 1000 Moisture Weighting Functions High spectral resolution advanced sounder will have more and sharper weighting functions compared to current GOES sounder. Retrievals will have better vertical resolution. UW/CIMSS
Concept GOES-10 sub-point water vapor Antarctica CO2
AMSU Temperature Retrievalsin the Arctic (Courtesy A. Reale)
Advanced Microwave Scanning Radiometer for EOS (AMSR-E) Products: Sea ice concentration Sea ice temperature Snow depth Snow area … As with SSM/I, but at twice the spatial resolution! (Courtesy NSIDC)
Launched January 2003 GLAS is both a surface laser ranging system and an atmospheric profiling lidar.
Future: The A-Train Launch now expected Nov ’04 Active cloud radar (90GHZ) First multi-satellite mission - the A-Train: Aqua, Cloudsat (cloud radar), Calypso (cloud-aerosol lidar), Parasol (polarized, multiangle), and Aura (chemistry). Satellites fly in formation within minutes of each other. (Cloudsat shown enlarged. Image courtesy of T. Vonder Haar)
Current satellite data IS being used to improve numerical weather forecasts. Examples include sounder radiances, microwave radiances, clear sky brightness temperatures, and geostationary and polar winds. With the exception of cloud top pressure in the NCEP Eta model (a new addition), cloudy sky satellite data is only in experimental systems. We have presented one methods of incorporating satellite-derived cloud information. However, this was in the context of a “reanalysis” rather than a forecast. It was shown that when cloud fields in the ARCSyM were altered using information from the APP-x data set, significant improvements in the monthly mean downwelling longwave radiation at the surface were observed. This is an exciting time for satellite remote sensing of the polar regions, and for the use of satellite data in NWP, because (a) we now have ~20 years of data for climate studies, and (b) new sensors improve retrieval accuracies and provide capabilities for new products. Conclusions