Download

1 / 25
250 likes | 342 Vues
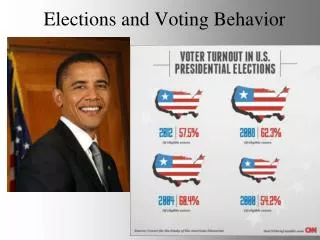
Happiness and Elections: Preliminary Slides from the ALP. February 22, 2009. About the American Life Panel (ALP). The ALP is a subset of the Health and Retirement Study and includes respondents who agreed to participate in a series of Internet-based survey modules or waves

E N D
Happiness and Elections: Preliminary Slides from the ALP February 22, 2009
About the American Life Panel (ALP) • The ALP is a subset of the Health and Retirement Study and includes respondents who agreed to participate in a series of Internet-based survey modules or waves • The analysis shown here is based on six survey waves: four during the primary season between April and June, one on the eve of the general election, and one immediately following the election • Each wave asks about levels of happiness, political affiliation, presidential choice, and other related questions • The panel nature of the data allows us to look at how changes in these variables are related
About the American Life Panel (ALP) • The principal variable of interest, happiness, is measured two ways: • Happiness index (0-100): A composite based on a series of indicator questions of whether in the last week the respondent felt happy, felt sad, enjoyed life, and felt depressed. Higher values indicate grater happiness. • Likert-type happiness scale: This variable exists only for the pre- and post-election survey, and records an 8-point scale for how happy the respondent is that day, with higher values indicating greater happiness. • We also examine the relationship of the happiness measures to how sensitive respondents report their emotional reactions are to daily news and events • We are also interested in how sensitive reported happiness is to personally unexpected events; e.g., the results of a presidential election
Changes in political affiliation (April through June) Notes: Coefficients represent mean marginal effects of initial happiness index from a logit model that also includes survey wave fixed effects. Standard errors are clustered on the individual respondent.
Strength of preferences and happiness reaction (1a):Pre- and post-election waves
Strength of preferences and happiness reaction (1b):Pre- and post-election waves
Strength of preferences and happiness reaction (2):Pre- and post-election waves
Strength of preferences and happiness reaction (3a):Pre- and post-election waves
Strength of preferences and happiness reaction (3b):Pre- and post-election waves
Strength of preferences and happiness reaction (4a):Pre- and post-election waves
Strength of preferences and happiness reaction (4b):Pre- and post-election waves
Emotional sensitivity and happiness reaction (1):Pre- and post-election waves
Emotional sensitivity and happiness reaction (2):Pre- and post-election waves
Bonus Slide: No Sarah Palin Effect • Despite much talk that Sarah Palin energized the Republican base, the ALP data do not bear this out: • Perceived feeling toward John McCain had four times the average marginal effect as feeling toward Sarah Palin in determining whether an ALP respondent voted Republican.
Crosstabs: ΔHappinessPre- and post-election waves Notes: Numbers represent the mean happiness difference in the quartile shown for the happiness measure shown.
Crosstabs: ΔHappinessPre- and post-election waves Notes: Numbers represent the mean happiness difference in the quartile shown for the happiness measure shown.
Crosstabs: ΔHappinessPre- and post-election waves Notes: Numbers represent the mean happiness difference in the quartile shown for the happiness measure shown.
Crosstabs: ΔHappinessPre- and post-election waves Notes: Numbers represent the mean happiness difference in the quartile shown for the happiness measure shown.
Crosstabs: ΔHappinessPre- and post-election waves Notes: Numbers represent the mean happiness difference in the quartile shown for the happiness measure shown.
Crosstabs: ΔHappinessPre- and post-election waves Notes: Numbers represent the mean happiness difference in the quartile shown for the happiness measure shown.
Hedonic Adaptation ΔHappiness RegressionsPre- and post-election waves