HuR Knockdown Reduces LPS-Induced Apoptosis in RAW264.7 Cells
40 likes | 122 Vues
This study examines how knockdown of HuR affects LPS-induced apoptosis in RAW264.7 cells using various treatments and analyzes mRNA expression levels. Results show decreased apoptosis in HuR knockdown cells. Protein expression levels of p53, TGF-β, and mdm-2 are also investigated post LPS treatment.

HuR Knockdown Reduces LPS-Induced Apoptosis in RAW264.7 Cells
E N D
Presentation Transcript
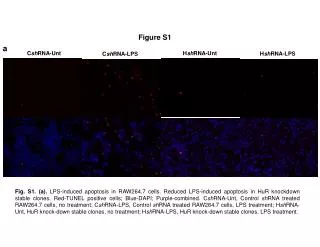
Figure S1 a HshRNA-Unt CshRNA-Unt HshRNA-LPS CshRNA-LPS Fig. S1. (a). LPS-induced apoptosis in RAW264.7 cells. Reduced LPS-induced apoptosis in HuR knockdown stable clones. Red-TUNEL positive cells; Blue-DAPI; Purple-combined. CshRNA-Unt, Control shRNA treated RAW264.7 cells, no treatment; CshRNA-LPS, Control shRNA treated RAW264.7 cells, LPS treatment; HshRNA-Unt, HuR knock-down stable clones, no treatment; HshRNA-LPS, HuR knock-down stable clones, LPS treatment.
Figure S1 b * # * % Apoptotic nuclei per HVF (Fig. S1. (b).Percent apoptotic cells averaged from ten high power visual fields (HVF). CshRNA-Unt, Control shRNA treated RAW264.7 cells, no treatment; CshRNA-LPS, Control shRNA treated RAW264.7 cells, LPS treatment; HshRNA-Unt, HuR knock-down stable clones, no treatment; HshRNA-LPS, HuR knock-down stable clones, LPS treatment. *P<0.01, untreated vs. LPS-treated groups; #P<0.01, between LPS-treated groups.
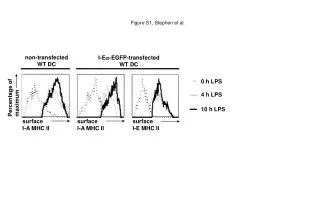
mRNA expression vs. 18s (fold change vs. control) Figure S2 HuR * C IL-10 LPS LPS+IL10 Fig S2. Quantitative real-time PCR analysis of HuR mRNA expression in RAW264.7 cells. Cells were treated with LPS (10ng/ml) and/or IL-10 (10ng/ml) for 2h. IL-10 inhibited LPS-mediated increases in HuR mRNA expression (*P<0.01 vs. LPS-treated cells). Values are the means ± SE from triplicate experiments.
Figure S3 CshRNA HshRNA Unt LPS Unt LPS mdm-2 β-actin TGF-β β-actin p53 β-actin Fig S3. p53, TGF-β and mdm-2 protein expression in RAW 264.7 cells. RAW264.7 cells were treated with LPS for 16hrs. Equal loading of proteins in each lane is shown by β-actin. CshRNA, Control shRNA treated RAW264.7 cells; HshRNA, HuR knock-down stable clones; Unt- untreated cells; LPS, LPS treated cells.