Download
1 / 17
170 likes | 186 Vues
Explore how changing climate affects the blooming date of tart cherries in Michigan and its impact on farmers. Analyze data, create mathematical models, and propose solutions to mitigate climate change.

E N D
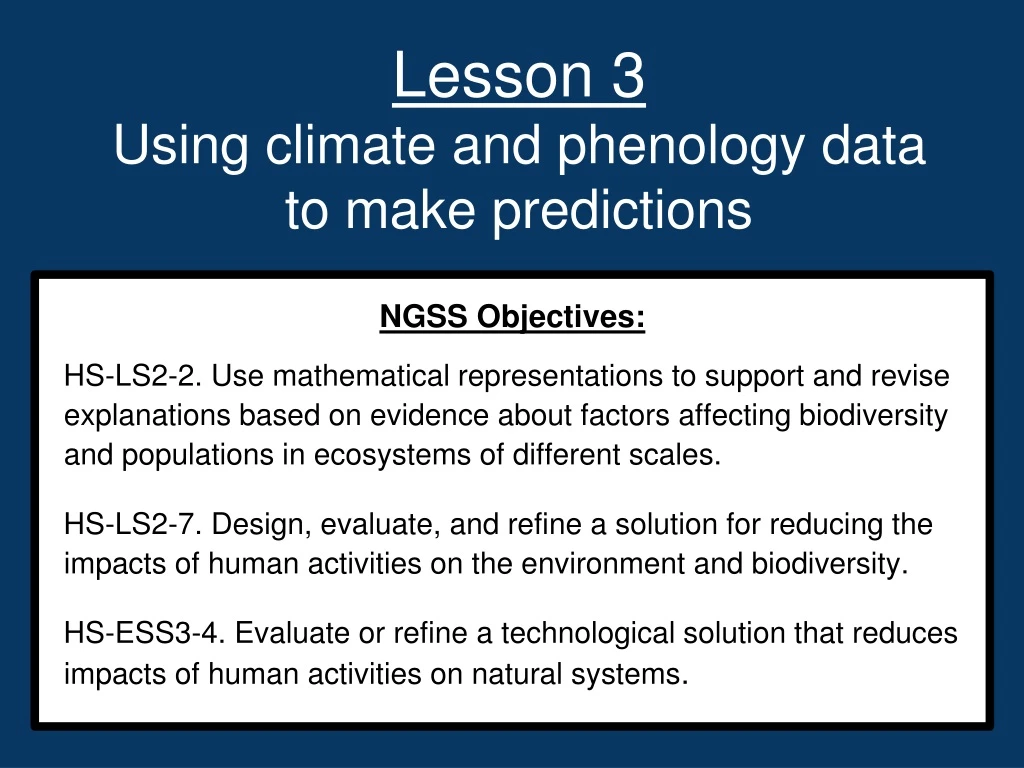
NGSS Objectives: HS-LS2-2. Use mathematical representations to support and revise explanations based on evidence about factors affecting biodiversity and populations in ecosystems of different scales. HS-LS2-7. Design, evaluate, and refine a solution for reducing the impacts of human activities on the environment and biodiversity. HS-ESS3-4. Evaluate or refine a technological solution that reduces impacts of human activities on natural systems. Lesson 3 Using climate and phenology data to make predictions
Review: Use the line of best fit to predict the bloom date if Avg. March temp. is:25 degrees? 30? 45? Blooming Date of Tart Cherries in Michigan as a function of March Temperature
Review: What did you find? What did you find to be the predicted Bloom Date if Avg. March Temp. was: • 0 degrees • 25 degrees • 30 degrees • 45 degrees • 173 =June 21 • 140/141 =May 19/20 • 134 =May 13 • 114/115 = April 23/24
You just created and used a model! What are scientific models?
Why use models? What are strengths and limitations of our model? Strengths Limitations • Variability/Accuracy • Extrapolation • Generalizability (other species, regions) • Doesn’t include frost data • Makes complicated dynamics easier to understand • Relatively accurate/strong power to predict • Helps us plan or take action
How can we make our model more accurate? Collect more data and add it to our model!
Let’s try it! • Download spreadsheetwith data and graph to your laptop • Add Temp. and Bloom Date for years 2013, 2014 and 2015 to the data table • How did the addition of this data change your graph? • How did the equation for the line of best fit change?
Updated model: Blooming Date of Tart Cherries in Michigan as a function of March Temperature y = -1.31x + 173.62
Online research (5 minutes): How is Michigan’s climate predicted to change in the future?
Changing Climate: Warmer winters: Late winter temperatures rising faster than other seasons + Variability in spring freezes → May result in more freeze damage early in the growing season
Projected increase in annual average temperature by 2041-2070 as compared to the 1971-2000 period.
Use your updated model to analyze the impact of climate change on Michigan cherries • According to your model, how much would the Bloom Date change if Michigan’s Avg. March Temp. (31 degrees) increased by: • 2 degrees? 4 degrees? 6 degrees? • How might this impact Michigan cherry farmers and the greater population?
What’s being done to help? Listen to rest of story: Fruit Growers Try Tricking Mother Nature to Prevent Crop Damage
What else are you left wondering? What other data might you want to gather in the future to help farmers better adapt to or prepare for this issue?
(OPTIONAL)Homework (on Worksheet 3) Time to get creative! Write a memo, letter or other creative form to a cherry farmer about what you have learned in this unit. (Details on Worksheet 3)