Size Effect
Size Effect. Matthew Boyce Huibin Hu Rajesh Raghunathan Lina Yang. Introduction. In this presentation we will review two articles on how the size of market capitalization affects portfolio performance.


Size Effect
E N D
Presentation Transcript
Size Effect Matthew Boyce Huibin Hu Rajesh Raghunathan Lina Yang
Introduction • In this presentation we will review two articles on how the size of market capitalization affects portfolio performance. • The data sets given in both articles support the basic argument that smaller size results in a superior performance.
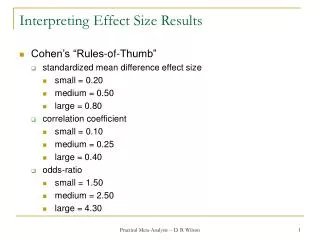
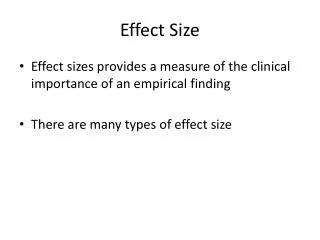
Size Effect • A theory that holds that smaller firms, or those companies with a small market capitalization, outperform larger companies. • The theory holds that smaller companies have a greater amount of growth opportunities than larger companies. • An effect size is typically calculated by taking the difference in means between two groups and dividing that number by their combined (pooled) standard deviation.
Abnormal Returns in Small Firm Portfolio Marc R. Reinganum
Capital Asset Pricing Model (CAPM) • E(R)=Rf+Beta*MRP • Beta • The most important term in the equation • Ameasure of the asset’s covariance with the market as a whole • COV (Ri,, Rm)/VAR(Rm), the risk of asset I relative to the market portfolio • Implication: any two assets with the same beta will have the same expected return. In particular, the model implies that firms will commend higher risk premiums only if they have higher betas.
Misspecifications of CAPM • Data on firm size can be used to create a portfolio that systematically earns abnormal returns. • Small firms systematically experienced abnormal rates of return. • Thepersistence of these abnormal returns reduces the likelihoodthe results are being generated by market inefficiency. • CAPM may not adequately describe the behavior of the stock prices.
Test of Abnormal Return • Collected stock prices, daily returns and common shares from University of Chicago’s center for research in Security Prices daily master and return tapes and the Compustat Merged Annual Industrial tape • For each year from 1962 through 1975, ranked all firms in the sample on the basis of their Dec. 31 aggregate stock market values • Broke down the ranked sample into deciles making all portfolios have betas near one and combined the daily returns of securities in each decile to form the daily returns of each portfolio 1 through 10, with 1 corresponding to the lowest decile and 10 to the highest • Equal weights were applied to all portfolio and equal weighted NYSE-AMEX market index serves as the control portfolio
Table 1 shows that the portfolio composed of small firms stand out. On average the smallest firms experience returns more than 20 percent per year higher than the returns for the largest firms. It is not only because of their positive abnormal returns, but also because each is heavily traded on the American Stock Exchange.
On the basis of firm size data, an investor can form portfolios that systematically earn abnormal returns that persist for at least two years.
Application The fact that small firms have systematically experienced average rates of return significantly greater than those of larger firms with equivalent beta risk, and that these abnormal returns have persisted for at least two years from the portfolio formation dates, indicates that the simple one-period CAPM is an inadequate empirical representation of capital market equilibrium. Alternative models of capital market equilibrium should be seriously considered and tested.
Portfolio Strategies based on Market Capitalization* No matter how you slice it, small caps win out Marc R. Reinganum
This paper explores some simple portfolio strategies suggested by the empirical relationship between stock returns and market capitalization.
Overview of Method • Included all stocks traded on NYSE & AMEX. • 10 portfolios with 10% of stocks in each. • Portfolios ranked from 1 to 10 (largest). • Funds remaining after delisting were placed in an S&P 500 index fund. • Two holding strategies: yearly balancing & buy and hold (1962-1980).
Overview of Results: Yearly Balancing • $1 invested in 1962 would equal $46 in smallest portfolio, $13 in intermediate, and $4 in large. • MV1 averaged 32.77% annual return; mid-sized averaged about 18%; and, MV10 averaged 9.47%. • Exception to rule found for the period of 1969 to 1973 (rule reversed).
Investment Characteristics of the Ten Market Value Portfolios
Beta Measure of volatility of a portfolio in comparison to the market as a whole. β = 1 security’s price will move with the market. β < 1 security will be less volatile than the market. β > 1 security will be more volatile than the market. E.g. If β = 1.2, theoretically that security is 20% more volatile than the market.
Dimson Beta • Why? – need to use the aggregated coefficients technique because standard market model beta may seriously understate the true beta of the small firm portfolio because of non-trading. • Suggest that small firms are riskier than the large firms. • 1.58 for the smallest - 0.96 for the largest • According to Reinganum, the spread in Dimson betas is not large enough to account for the observed difference in the average portfolio returns.
Important Observations • Size effect vs. listing effect (AMEX). • Dimson Beta unable to capture real beta of small firms. • CAPM is an inadequate model for this study. ΔE(R) = Δβ[E(RM) – Rf] =23.3%/.62 = ΔE(R)/Δβ (Only if risk-free rate = 37.5%)
Take away lesson Size effects exists even after beta adjustments.
Cumulative Returns with Annual Updating (Expressed in Percentages)
Cumulative Percent Return for Market Value Portfolios (1963-1980) with Annual Updating
Summary Results for Annually Updated Market Value Portfolios • Portfolio 9 showed 570% increase, vs. 312% for portfolio 10. • Smaller portfolios more sensitive to market volatility. • Smallest portfolio still beats large firms (265% since 1969).
Cumulative Returns without Annual Updating (Expressed in Percentages)
Summary Results for Market Value Portfolios Without Annually Updating • Portfolio 1 returns exceeded those of portfolio 10 by almost 700%. • Active is better than passive. ($1 invested smallest in 1963 leads to $46 or $11 return.) • Only the largest portfolio did not benefit from updating.
Distribution of One-Year Holding Period Returns for Securities within Each Market Value Group
Critique of Article • Lacking in data regarding the statistical significance of findings. • Period is limited (18 years). • Discussion of U.S. economic trends for the period is not discussed. • Common size classifications used by investors are not included.
Conclusion Invest in small market cap portfolio over a longer period of time!