Understanding Effect Sizes in Meta-Analysis
Explore different types of effect sizes for meta-analysis, including correlation coefficients, odds ratios, and standardized mean differences. Learn how to calculate and interpret effect sizes based on research contexts.

Understanding Effect Sizes in Meta-Analysis
E N D
Presentation Transcript
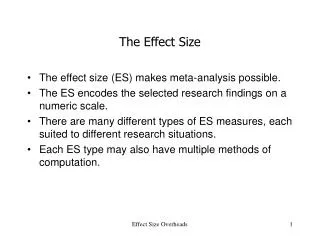
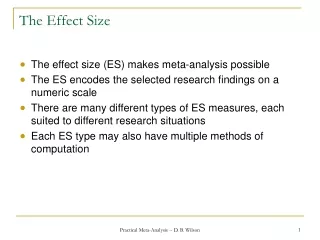
The Effect Size • The effect size (ES) makes meta-analysis possible • The ES encodes the selected research findings on a numeric scale • There are many different types of ES measures, each suited to different research situations • Each ES type may also have multiple methods of computation Practical Meta-Analysis -- D. B. Wilson
Examples of Different Types of Effect Sizes • Standardized mean difference • Group contrast research • Treatment groups • Naturally occurring groups • Inherently continuous construct • Odds-ratio • Group contrast research • Treatment groups • Naturally occurring groups • Inherently dichotomous construct • Correlation coefficient • Association between variables research Practical Meta-Analysis -- D. B. Wilson
Examples of Different Types of Effect Sizes • Risk ratio • Group differences research (naturally occurring groups) • Commonly used by epidemiologist and medical meta-analyses • Inherently dichotomous construct • Easier to interpret than the odds-ratio Practical Meta-Analysis -- D. B. Wilson
Examples of Different Types of Effect Sizes • Proportion • Central tendency research • HIV/AIDS prevalence rates • Proportion of homeless persons found to be alcohol abusers • Standardized gain score • Gain or change between two measurement points on the same variable • Reading speed before and after a reading improvement class • Others? Practical Meta-Analysis -- D. B. Wilson
What Makes Something an Effect Sizefor Meta-analytic Purposes • The type of ES must be comparable across the collection of studies of interest • This is generally accomplished through standardization • Must be able to calculate a standard error for that type of ES • The standard error is needed to calculate the ES weights, called inverse variance weights (more on this latter) • All meta-analytic analyses are weighted Practical Meta-Analysis -- D. B. Wilson
The Standardized Mean Difference • Represents a standardized group contrast on an inherently continuous measure • Uses the pooled standard deviation (some situations use control group standard deviation) • Commonly called “d” or occasionally “g” Practical Meta-Analysis -- D. B. Wilson
The Correlation Coefficient • Represents the strength of association between two inherently continuous measures • Generally reported directly as “r” (the Pearson product moment coefficient) Practical Meta-Analysis -- D. B. Wilson
The Odds-Ratio • The odds-ratio is based on a 2 by 2 contingency table, such as the one below • The Odds-Ratio is the odds of success in the treatment group relative to the odds of success in the control group. Practical Meta-Analysis -- D. B. Wilson
The Risk Ratio • The risk ratio is also based on data from a 2 by 2 contingency table, and is the ratio of the probability of success (or failure) for each group Practical Meta-Analysis -- D. B. Wilson
Unstandardized Effect Size Metric • If you are synthesizing are research domain that using a common measure across studies, you may wish to use an effect size that is unstandardized, such as a simple mean difference (e.g., dollars expended) • Multi-site evaluations or evaluation contracted by a single granting agency Practical Meta-Analysis -- D. B. Wilson
Effect Size Decision Tree for Group Differences Research (Page 58 of Book) Practical Meta-Analysis -- D. B. Wilson
Methods of Calculating the Standardized Mean Difference • The standardized mean difference probably has more methods of calculation than any other effect size type • See Appendix B of book for numerous formulas and methods. Practical Meta-Analysis -- D. B. Wilson
Degrees of Approximation to the ES ValueDepending of Method of Computation • Direct calculation based on means and standard deviations • Algebraically equivalent formulas (t-test) • Exact probability value for a t-test • Approximations based on continuous data (correlation coefficient) • Estimates of the mean difference (adjusted means, regression B weight, gain score means) • Estimates of the pooled standard deviation (gain score standard deviation, one-way ANOVA with 3 or more groups, ANCOVA) • Approximations based on dichotomous data Great Good Poor Practical Meta-Analysis -- D. B. Wilson
Methods of Calculating the Standardized Mean Difference Direction Calculation Method Practical Meta-Analysis -- D. B. Wilson
Methods of Calculating the Standardized Mean Difference Algebraically Equivalent Formulas: independent t-test two-group one-way ANOVA exact p-values from a t-test or F-ratio can be converted into t-value and the above formula applied Practical Meta-Analysis -- D. B. Wilson
Methods of Calculating the Standardized Mean Difference A study may report a grouped frequency distribution from which you can calculate means and standard deviations and apply to direct calculation method. Practical Meta-Analysis -- D. B. Wilson
Methods of Calculating the Standardized Mean Difference Close Approximation Based on Continuous Data -- Point-Biserial Correlation. For example, the correlation between treatment/no treatment and outcome measured on a continuous scale. Practical Meta-Analysis -- D. B. Wilson
Methods of Calculating the Standardized Mean Difference • Estimates of the Numerator of ES -- The Mean Difference • difference between gain scores • difference between covariance adjusted means • unstandardized regression coefficient for group membership Practical Meta-Analysis -- D. B. Wilson
Methods of Calculating the Standardized Mean Difference Estimates of the Denominator of ES -- Pooled Standard Deviation standard error of the mean Practical Meta-Analysis -- D. B. Wilson
Methods of Calculating the Standardized Mean Difference Estimates of the Denominator of ES -- Pooled Standard Deviation one-way ANOVA >2 groups Practical Meta-Analysis -- D. B. Wilson
Methods of Calculating the Standardized Mean Difference Estimates of the Denominator of ES -- Pooled Standard Deviation standard deviation of gain scores, where r is the correlation between pretest and posttest scores Practical Meta-Analysis -- D. B. Wilson
Methods of Calculating the Standardized Mean Difference Estimates of the Denominator of ES -- Pooled Standard Deviation ANCOVA, where r is the correlation between the covariate and the DV Practical Meta-Analysis -- D. B. Wilson
Methods of Calculating the Standardized Mean Difference Estimates of the Denominator of ES -- Pooled Standard Deviation A two-way factorial ANOVA where B is the irrelevant factor and AB is the interaction between the irrelevant factor and group membership (factor A). Practical Meta-Analysis -- D. B. Wilson
Methods of Calculating the Standardized Mean Difference Approximations Based on Dichotomous Data the difference between the probits transformation of the proportion successful in each group converts proportion into a z-value Practical Meta-Analysis -- D. B. Wilson
Methods of Calculating the Standardized Mean Difference Approximations Based on Dichotomous Data this represents the rescaling of the logged odds-ratio (see Sanchez-Meca et al 2004 Psychological Methods article) Practical Meta-Analysis -- D. B. Wilson
Methods of Calculating the Standardized Mean Difference Approximations Based on Dichotomous Data chi-square must be based on a 2 by 2 contingency table (i.e., have only 1 df) phi coefficient Practical Meta-Analysis -- D. B. Wilson
Formulas for the Correlation Coefficient • Results typically reported directly as a correlation • Any data for which you can calculate a standardized mean difference effect size, you can also calculate a correlation type effect size • See appendix B for formulas Practical Meta-Analysis -- D. B. Wilson
Formulas for the Odds Ratio • Results typically reported in one of three forms: • Frequency of successes in each group • Proportion of successes in each group • 2 by 2 contingency table • Appendix B provides formulas for each situation Practical Meta-Analysis -- D. B. Wilson
Data to Code Along With the ES • The effect size • May want to code the data from which the ES is calculated • Confidence in ES calculation • Method of calculation • Any additional data needed for calculation of the inverse variance weight • Sample size • ES specific attrition • Construct measured • Point in time when variable measured • Reliability of measure • Type of statistical test used Practical Meta-Analysis -- D. B. Wilson
Issues in Coding Effect Sizes • Which formula to use when data are available for multiple formulas • Multiple documents/publications reporting the same data (not always in agreement) • How much guessing should be allowed • sample size is important but may not be presented for both groups • some numbers matter more than others Practical Meta-Analysis -- D. B. Wilson