Step-by-Step Guide to Interpreting Seismic Lines: Identifying Horizons and Faults
70 likes | 220 Vues
This guide provides a systematic approach to interpreting seismic lines, focusing on horizon identification and fault analysis. Begin by locating the primary horizon, indicated at CMP 1001. Follow through to identify a white trough occurring at 650 ms, marking it in yellow for clarity. Track the horizon across the section, noting any breaks. Finally, pinpoint and classify faults, marking the downthrow sides with arrows. The faults revealed in this section are both normal, with throws of approximately 50 ms.

Step-by-Step Guide to Interpreting Seismic Lines: Identifying Horizons and Faults
E N D
Presentation Transcript
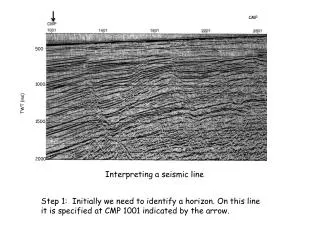
CMP 500 1000 TWT (ms) 1500 2000 Interpreting a seismic line Step 1: Initially we need to identify a horizon. On this line it is specified at CMP 1001 indicated by the arrow.
CMP 500 1000 TWT (ms) 1500 2000 Interpreting a seismic line Step 2: The horizon is a white trough and occurs at 650 ms, marked by the second arrow.
CMP 500 1000 TWT (ms) 1500 2000 Interpreting a seismic line Step 3: To make it easy to see, the horizon must be marked with its own colour, which in this case is yellow.
CMP 500 1000 TWT (ms) 1500 2000 Interpreting a seismic line Step 4: Next the horizon is followed across the whole section, leaving gaps if there are jumps or breaks in the horizon.
CMP 500 1000 TWT (ms) 1500 2000 Interpreting a seismic line Step 5: The course of any faults down through the section are then marked.
CMP 500 1000 TWT (ms) 1500 2000 Interpreting a seismic line Step 6: The faults type is then identified, marking the downthrow side with arrows. Both the red and blue faults are normal, with the downthrow to the high CMP end.
CMP 500 1000 TWT (ms) 1500 2000 Interpreting a seismic line Step 7: Both faults have a throw of around 50 ms, marked with the green line.