Interpreting Graphs: Understanding Data Visualization in Geography
In Geography, graphs are essential for visualizing data, making it more engaging and comprehensible. This guide explores the basics of interpreting graphs, addressing key questions such as what the title indicates, the significance of scales, and the meaning behind graph elements like bars and quartiles. By examining the data represented, you’ll learn how to determine trends, such as which type is most popular, and why that might be the case. Grab your copies of the graphs for hands-on practice and improve your data interpretation skills.


Interpreting Graphs: Understanding Data Visualization in Geography
E N D
Presentation Transcript
Interpreting Graphs or what do these graphs mean ?
Interpreting Guten Tag 7x -3 = 4 Bonjour Cu H O I Norge mann sprache norsk
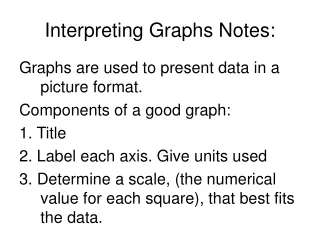
Graphs We use graphs in Geography to make data that we collect more interesting to look at and hopefully easier to understand.
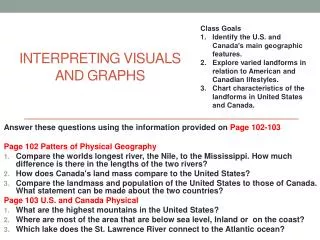
What does this mean ? Is there a title ? Why are there 3 bars ? Look at the scales What’s a Qtr ?
Our Graphs Our next job is to interpret them… You will need your copy of your graphs Think: Title Scales Which type is most popular ? Why do you think that is the case ?