Interpreting Graphs
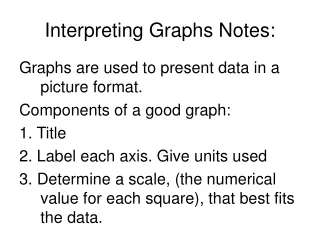
Interpreting Graphs. Lesson 1.1. Vocabulary Independent Variable Dependent Variable Units. Lesson 1.1 – Example 1. 1. What are the independent and dependent variables? 2. What units would be appropriate to use for this graph? 3. What does the flat part of the graph represent?

Interpreting Graphs
E N D
Presentation Transcript
Lesson 1.1 • Vocabulary • Independent Variable • Dependent Variable • Units
Lesson 1.1 – Example 1 1. What are the independent and dependent variables? 2. What units would be appropriate to use for this graph? 3. What does the flat part of the graph represent? 4. The first section of the graph is steeper than the last section. Was the bus traveling faster in the first part or last part of the trip?
Lesson 1.1 – Example 2 1. What are the independent and dependent variables? 2. What do the flat parts of the graph represent? 3. Circle the sections of the graph that show speed decreasing.
Lesson 1.1 – Example 3 Sketch a graph to describe the following. Explain the activity in each section of the graph. • The height an airplane is above the ground flying from Dallas, TX to Atlanta, GA. • Step 1: Identify the independent and dependent variables. • Step 2: Draw the graph.
Lesson 1.1 – Example 4 Sketch a graph to describe the following. Explain the activity in each section of the graph. • The speed of a person driving to the store and having to stop at two stoplights. • Step 1: Identify the independent and dependent variables. • Step 2: Draw the graph.
Lesson 1.1 – Activity • Write your own situation/story like you saw in examples 3 and 4. • Exchange stories with your partner. • Sketch the graph that matches your partner’s story. Then create 3 questions about the graph. • Give the story back to its original owner and answer the questions they asked. • Discuss the answers.