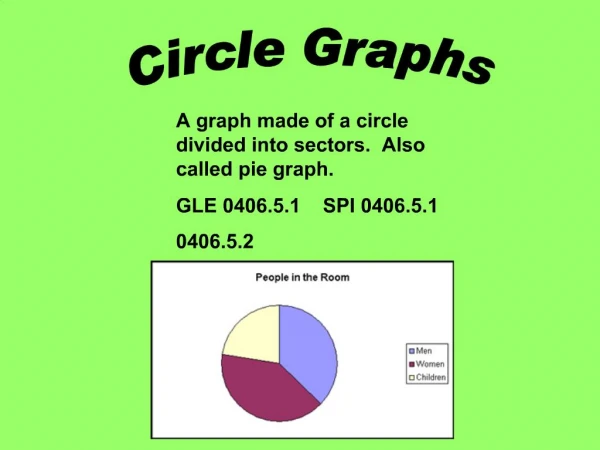
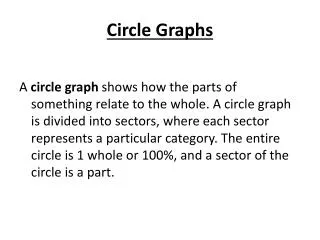
Interpreting Circle Graphs
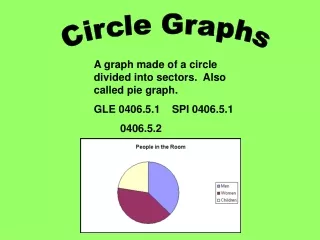
Interpreting Circle Graphs. SOL 6.14. The circle graph represents the Jones family budget. If the monthly budget is $2500.00 how much does the Jones family spend on….


Interpreting Circle Graphs
E N D
Presentation Transcript
Interpreting Circle Graphs SOL 6.14
The circle graph represents the Jones family budget. If the monthly budget is $2500.00 how much does the Jones family spend on….
The circle graph represents the number of students in Miss Carroll’s Block 4 class and their movie selections. If there are 24 students in the class what percent of the class selected….
The circle graph represents the extra income spending for the Smith family. Use the degree measures given to determine the percent spent on …..
Your Turn Independent Practice (Yes this will be graded)
The circle graph represents the number of magazines in Tonya’s magazine collection. If there are 20 magazines in her collection what percent of the collection is …….
The circle graph represents the music preferences of students at Adam’s school. If there are a total of 250 students at Adam’s school, how many students chose….
The circle graph represents the dietary preferences of students in a high school health class. Use the degree measures given to determine the percent of students who selected…..