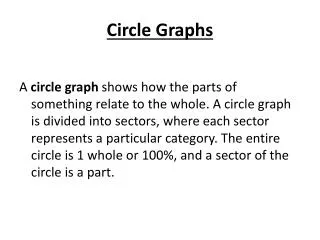
Circle Graphs
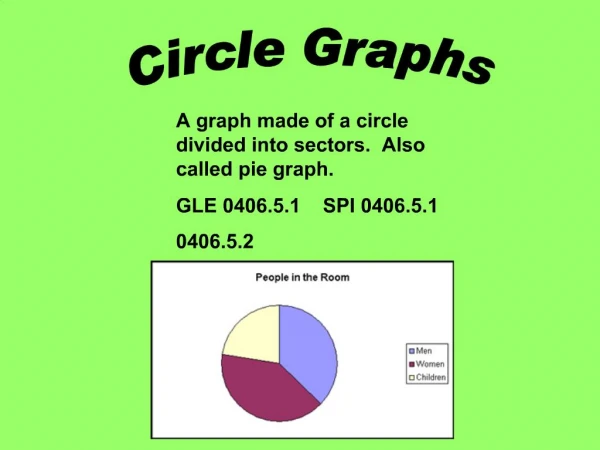
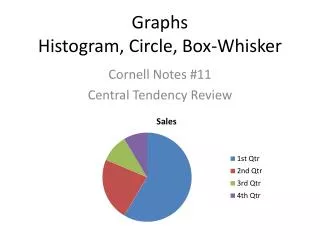
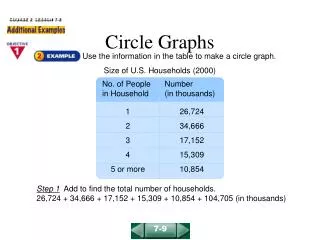
No. of People in Household. Number (in thousands). 1 2 3 4 5 or more. 26,724 34,666 17,152 15,309 10,854. COURSE 2 LESSON 7-9. Circle Graphs. Use the information in the table to make a circle graph. Size of U.S. Households (2000).

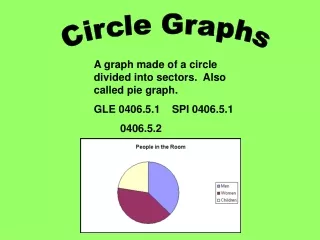
Circle Graphs
E N D
Presentation Transcript
No. of People in Household Number (in thousands) 1 2 3 4 5 or more 26,724 34,666 17,152 15,309 10,854 COURSE 2 LESSON 7-9 Circle Graphs Use the information in the table to make a circle graph. Size of U.S. Households (2000) Step 1 Add to find the total number of households. 26,724 + 34,666 + 17,152 + 15,309 + 10,854 + 104,705 (in thousands) 7-9
Step 2 For each central angle, set up a proportion to find the angle measure. Use a calculator to solve. 26,724 104,705 a 360 34,666 104,705 b 360 17,152 104,705 c 360 = = = a 91.9° b 119.2° f 37.3° c 59.0° 15,309 104,705 d 360 10,854 104,705 f 360 = = d 52.6° Step 3 Draw a circle. Draw the central angles using the degrees found in Step 2. Label each section. Add a title. Add a key if necessary. COURSE 2 LESSON 7-9 Circle Graphs (continued) 7-9
COURSE 2 LESSON 7-9 Circle Graphs The circle graph shows how a class of 48 students spends free time after lunch. 1. What percent study or do extracurricular activities? 2. How many students spend time on extracurricular activities? 3. Find the measure of the central angle that you would draw to represent 15% in a circle graph. 39% 12 54º 7-9