
Uploaded by
talasi
1 SLIDES
225 VUES
20LIKES
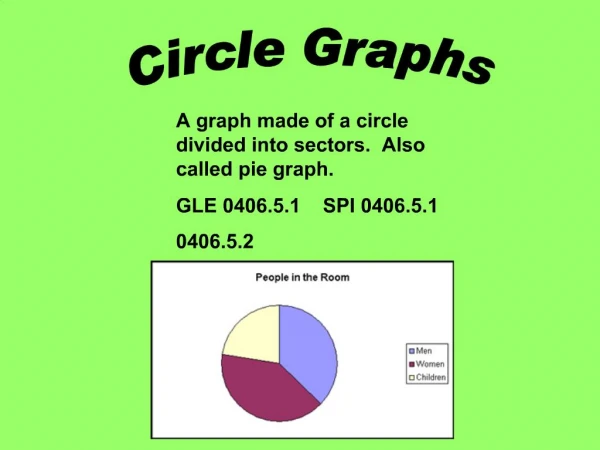
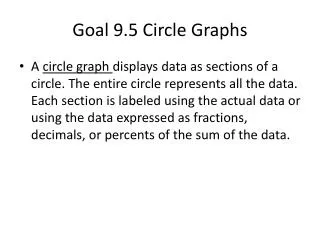
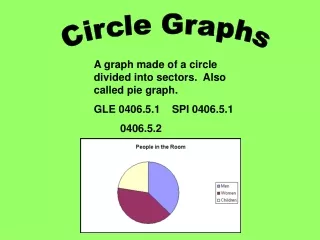
Circle Graphs
DESCRIPTION
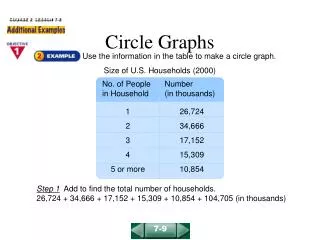
1,308 • 36.4% = 1,308 0.364 476.112. COURSE 3 LESSON 10-6. Circle Graphs. Use this circle graph for a school with a total enrollment of 1,308 students. a. What percent of the students are in the eighth grade?. Use the key. The enrollment for
Download

1 / 1
Télécharger la présentation 
Circle Graphs
An Image/Link below is provided (as is) to download presentation
Download Policy: Content on the Website is provided to you AS IS for your information and personal use and may not be sold / licensed / shared on other websites without getting consent from its author.
Content is provided to you AS IS for your information and personal use only.
Download presentation by click this link.
While downloading, if for some reason you are not able to download a presentation, the publisher may have deleted the file from their server.
During download, if you can't get a presentation, the file might be deleted by the publisher.
E N D
Presentation Transcript
1,308 • 36.4% = 1,308 0.364 476.112 COURSE 3 LESSON 10-6 Circle Graphs Use this circle graph for a school with a total enrollment of 1,308 students. a. What percent of the students are in the eighth grade? Use the key. The enrollment for the eighth grade is graphed in green. So 36.4% of the students in Central Middle School are in the eighth grade. b. How many students are in the eighth grade? There are about 476 students enrolled in the eighth grade. 10-6


More Related