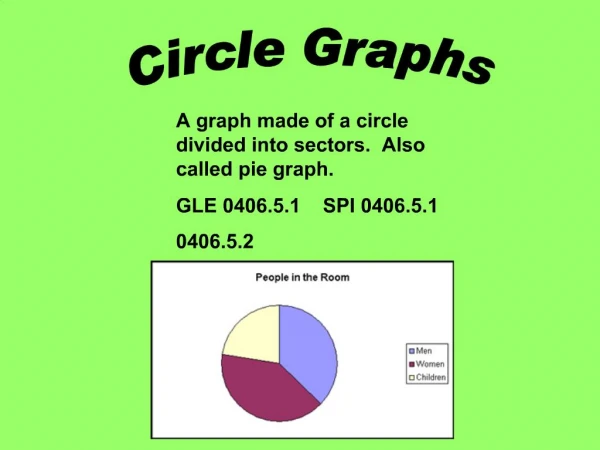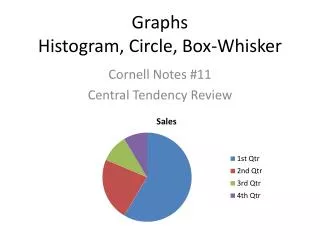
Circle Graphs
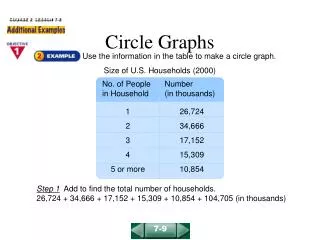
Circle Graphs. A step by step how to. Example 1. A software company asked 60 owners what they use their computers for most. Of these owners, 21 said word processing, 18 said spreadsheets, 6 said Internet access, and 15 had other responses. Use a circle graph to display these results.


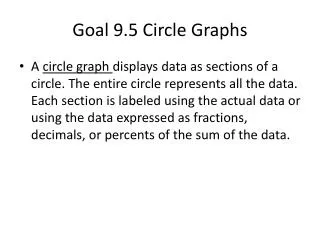
Circle Graphs
E N D
Presentation Transcript
Circle Graphs A step by step how to.
Example 1 A software company asked 60 owners what they use their computers for most. Of these owners, 21 said word processing, 18 said spreadsheets, 6 said Internet access, and 15 had other responses. Use a circle graph to display these results.
Step 2: Find the percent of computer owners giving each response. Rememberto find percent set it up as follows… Part x 100 = Percent Whole
Step 3: Use these percents to find the angle measures of the sectors of the circle graph. To find the angle measure, multiply the percent by 360º. 0.35 x 360º = 126º 0.30 x 360º = 108º 0.10 x 360º = 36º 0.25 x 360º = 90º
Step 5: Use a protractor to draw sectors having the angle measures found in step 3. 126º .
Step 5: Use a protractor to draw sectors having the angle measures found in step 3. Word Processing 35% 108º Label each sector with the corresponding response & percent.
Label each sector with the corresponding response & percent. Step 5: Use a protractor to draw sectors having the angle measures found in step 3. Word Processing 35% 36º 30% Spreadsheets
Step 5: Use a protractor to draw sectors having the angle measures found in step 3. 90º Word Processing 35% 10% Internet access 30% Spreadsheets Label each sector with the corresponding response & percent.
Step 5: Use a protractor to draw sectors having the angle measures found in step 3. 25% Word Processing Other 35% 10% Internet access 30% Spreadsheets Label each sector with the corresponding response & percent.
Step 6: Title your circle graph. Computer Use 25% Word Processing Other 35% 10% Internet access 30% Spreadsheets
Example 2 Recently, in our afternoon tutoring we counted the candy colors in a 1 pound bag of M & M’s. We came up with the following data… red = 109blue = 51green = 23yellow = 95brown = 31orange= 46 purple = 61 Make a circle graph to show the percent of each color of the M & M’s in the 1 pound bag.
After I organized my data in a table, what should I do next?