Download
1 / 66
670 likes | 879 Vues
Iowa Comprehensive Highway Safety Plan (CHSP). Tom Welch State Transportation Safety Engineer Office of Traffic and Safety Iowa Department of Transportation Tom.Welcht@dot.iowa.gov. SAFETEA-LU Requirements. Highway Safety Improvement Program (HSIP).

E N D
Iowa Comprehensive Highway Safety Plan (CHSP) Tom Welch State Transportation Safety Engineer Office of Traffic and SafetyIowa Department of Transportation Tom.Welcht@dot.iowa.gov
SAFETEA-LU Requirements Highway Safety Improvement Program (HSIP) Purpose: to achieve a significant reduction in traffic fatalities and serious injuries on public roads
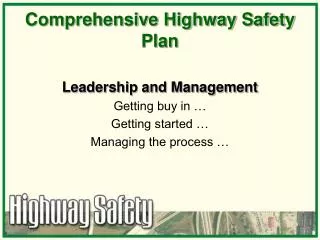
SAFETEA-LU Requirements Strategic Highway Safety Plans (SHSP) • Developed by DOT after consultation with prescribed safety stakeholders • Analyzes and makes effective use of crash data • Addresses four E’s plus management and operations • Engineering, Education, Enforcement, and Emergency Response
SAFETEA-LU Requirements Strategic Highway Safety Plans (SHSP) • Considers safety needs of all public roads • Describes program of projects or strategies to reduce or eliminate safety hazards • Approved by state governor or responsible state agency
Iowa’s CHSP Iowa’s plan will be “Comprehensive” rather than “Strategic”
Highway SafetyWhy a Congressional Priority Now?“Americans can do more to improve highway safety” • “…43,000 deaths per year” • “Every year this country experiences a national tragedy that is as preventable as it is devastating.” • “The enormous cost to society is about $230 billion, or $820 per person.” • Transportation Secretary Leon Mineta April 2006
10th Global Safety ComparisonsFatality Rate (2002 Data) – Deaths/1B kmVT • United Kingdom 7.6 • Sweden 8.3 • Norway 8.3 • Switzerland 8.4 • Finland 8.5 • Australia 9.0 • Denmark 9.2 • Canada 9.3 • USA 9.4 • Germany 11.1 (Source: IRTAD 2004)
Safety Culture Why Success in Other Industrialized Nations ? “Safety Culture” • United Kingdom • Typical speeding, safety belt or cell phone traffic violation fine £ 1,000 = $1,893 • Automated speed enforcement is commonly employed • Sweden • “Vision Zero” national goal is NO highway deaths • The lowest legal level is .02 BAC
Safety Culture Why Success in Other Industrialized Nations ? “Safety Culture” • Norway • Increased traffic fines up to 30 percent in 2003 • Driving under the influence carries mandatory jail time. Denmark: • Fines are collected on-the-spot for the infringement of all traffic regulations.
Traffic fines generally are based on two factors: the severity of the offense the driver's income “Jaako Rytsola, a 27-year-old Finnish Internet entrepreneur and newspaper columnist, was cruising in his BMW one recent evening. The officer pulled over Mr. Rytsola's car and issued him a speeding ticket for driving 43 miles an hour in a 25-mile-an-hour zone. The fine: $71,400.” Safety Culture Finland“When it comes to crime, the wealthy should suffer as much as the poor.”
From nearly identical rates in 1980, the Australian rate has fallen to a point where it is now a little more than half the U.S. rate. (Based on public health measures of deaths/population) Implementing the “Halving Fatalities” goal introduced several traffic safety legislative and regulatory amendments to increase police powers, sharpen laws, and increase penalties. Safety Culture Australia - Most like the U.S.Government, Road Systems and Travel Patterns HALVING Roadway Fatalities A Case Study from Victoria, Australia 1989-2004
Safety Culture Australia’sSafety Culture Based on Every Driver’s Responsibility: Impairment • .05 blood alcohol content (BAC) for all drivers • Zero BAC first three years after licensing and for taxi drivers • Immediate license loss for all drunk-driver second or subsequent offenses HALVING Roadway Fatalities A Case Study from Victoria, Australia 1989-2004
Safety Culture Australia’sSafety Culture Based on Every Driver’s Responsibility: Enforcement • Increased random breath testing: Efforts increased five-fold resulting in one in three drivers likely (statistically) to be tested annually • Introduced automated speed limit enforcement with cameras HALVING Roadway Fatalities A Case Study from Victoria, Australia 1989-2004
Safety Culture Australia’sSafety Culture Based on Every Driver’s Responsibility: Vulnerable Road users • Mandatory bicycle helmet use law (motorcycle helmet law since 1960’s) Education • Long-term program of public education to support specific safety initiatives and keep traffic safety in the public arena HALVING Roadway Fatalities A Case Study from Victoria, Australia 1989-2004
Safety Culture Australia’s Success Factors • A Sound and Realistic Plan • Political and Bureaucratic Leadership • Integrated Implementation • Other Enabling Factors • Past success • Strong relationships • Sound data for evidence-based decisions • Public education • Supportive media = Results: A Safety Culture Change HALVING Roadway Fatalities A Case Study from Victoria, Australia 1989-2004
Safety Culture Change the Safety Culture “I would conclude that one of the failures in the United States is to get highway safety as a high priority for key decision makers.” -Brian O’Neill , President and CEO Insurance Institute for Highway Safety
Safety Culture Driver-Based Strategies "We have the tools to prevent this tragedy – every car has a safety belt, every motorcycle rider should have a helmet, and everyone should have enough sense to never drive while impaired.” Transportation Secretary Norman MinetaApril 2006
1 Murder every 7.1 days 1 Violent Crime every 70 minutes 1 Property Crime every 6 minutes 1 Crime every 5.5 minutes IowaCrimeCrashClock 1 Fatality every 20 hours 1 Injury every 20 minutes 1 Property Damage every 14 minutes 1 Crash every 9 minutes
2006 439
-0.76 -0.16 -1.26 -0.54 0.64 -0.65 -0.46 -0.39 -0.30 -0.39 0.06 -0.25 0.19 -0.08 -0.23 0.13 -0.07 -0.52 -0.02 -0.17 -0.17 -0.17 -0.57 0.81 -0.02 -0.29 0.02 0.05 0.23 0.29 -0.33 0.10 0.19 0.21 -0.15 0.01 0.29 0.17 DC -0.06 0.79 0.30 0.23 0.44 Iowa’s fatality rate is .52 less than expected …given where its VMT occurs -0.18 0.12 0.46 0.23 0.34 0.19 0.41 -1.30 to zero Zero to 0.83 -0.10 Puerto Rico Virgin Islands Charles (Tony) Aiken FHWA tony.aiken@fhwa.dot.gov Expected Fatality Rates –How Does Iowa Rank?(Weighted by Distribution of VMT) Compared to Actual Fatality Rates
Iowa Success Impairment • 24 percent alcohol involvement crashes • 2nd lowest rate in the nation Occupant Protection • 90 percent belt usage • 10th highest in the nation Young Drivers • Reduction in young driver traffic crashes and convictions
Basis of Iowa SuccessLegislative Support • In 1982, Iowa passed its first per se OWI law. • In July 1987, Iowa’s primary seatbelt law was enacted and the “Life Toll” was at 5752 lives saved as of 9/01/06. • On January 1, 1999, Iowa’s Graduated Driver License (GDL) law took effect creating a three tier licensing system for young drivers.
Basis of Iowa SuccessLegislative Support • In 1987, Iowa’s legislature provided that one-half of one percent (1/2 percent) of Iowa’s Road Use Tax Fund be used for the Traffic Safety Improvement Program or studies for state or local public roads.
Basis of Iowa SuccessLegislative Support • In 2003, Iowa joined most of the nation in adopting a .08 BAC impaired driving law. • In 2004, Iowa’s 1987 child restraint provisions were enhanced to adopt more of the guidelines proven to increase child survivability in crashes. (Effective 01/01/2006)
Basis of Iowa SuccessProgram Support • In 2004, Iowa DOT adopted a paved shoulder and rumble strip policy on selected two-lane and four-lane facilities. In 2005, 298 miles of shoulders were paved. • Iowa DPS and GTSB continue to coordinate multi-agency, high-profile enforcement efforts.
Basis of Iowa SuccessProgram Support • GTSB and the Department of Public Health continue to support child safety seat awareness and technician training. • In the last decade, the Iowa DOT replaced about a thousand miles of high volume high-crash two-lane roads with four-lane divided roads. • The Iowa DNR has made progress in reducing the Iowa deer herd.
More Work to Be Done… • In Iowa the “low hanging fruit” has been picked. • More lives can be saved. • Proven strategies are available to “reach the remaining fruit.”
Revise next slide with Engineering Week family Engineering Week Display Ad
Iowa Safety Challenges These traffic measures are increasing: • Overall vehicle miles traveled (VMT) • Drivers’ licenses and vehicle registrations (SUVs and pickups) • Commercial vehicle miles • Iowans commute more miles for work = more high-speed congestion Enforcement • Fewer traffic enforcement officers statewide Certain Iowa drivers are more "at risk" • Older Iowans are driving more miles, and continuing to later in life • Motorcycle fatalities, licensing, registration and ridership are up dramatically • SUV’s and pickups are more prone to roll over in crashes • Less attentive and less safety conscious drivers
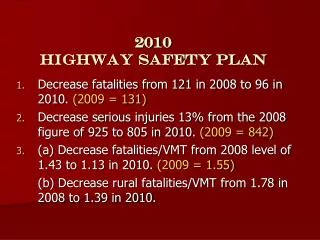
Iowa’s Safety Challenge • “Each year hundreds of people will continue to die and thousands will be injured if Iowa does not become an agent of cultural change for traffic safety.” • “Despite the steep decline in traffic fatalities over the past 20 years, Iowa is at risk of maintaining the plateau at around 445 deaths per year.” • “If Iowa does not embark on a movement toward changing the safety culture, the number of traffic fatalities and serious injuries is likely to increase.” - Susan Herbal, PhD Cambridge Systematics
Highway Crashes are Complex • Driver conditions and behavior • A contributing factor in 95 percent of crashes • Primary factor in 67 percent of crashes • Roadway design and environment • A contributing factor in 28 percent of crashes • Primary factor in 4 percent of crashes • Vehicle • A contributing factor in 8 percent of crashes • Primary factor in 4 percent of crashes
Engineering Enforcement Education Highway Safety Everyone Else Emergency Response …And So are the SolutionsThe “Five E’s” of Highway Safety
Thus, Iowa’s Plan will be “Comprehensive” rather than “Strategic”
Iowa’s CHSP Will Be Data-Driven What will really move the numbers?
Please note that these categories are not necessarily mutually exclusive. Typical yearly fatality totals for Iowa range from 400-450 deaths.
Top 8 Target Areas Iowa Recommended by CHSP Safety Summit Vote • Distracted Drivers • Young Drivers • Occupant Protection • Lane Departure • Older Persons Mobility • Impaired Driver • Intersections • Local Roads April 26, 2006 - 100+ Summit AttendeesApril 27, 2006 - 60 SMS Attendees
“Charge” to the 8 Target Area Teams The purpose is to “target” strategies that will: “Change the Culture” and “Move the Numbers”
“The plan must not only be evidence-based, but it must have sharp teeth.” HALVING Roadway Fatalities, A Case Study from Victoria, Australia, 1989-2004
Top 5 Policy Strategies Young Driver SafetyLegislative Strengthen MSL/GDL driver license laws with stronger provisions that are proven to reduce specific risks and save lives. • Raise the school license age • Increase practice hours with parents • Reduce night driving • Restrict passengers • Require occupant restraints in all seating positions • Prohibit cell phone use while operating a vehicle
Top 5 Policy Strategies Occupant ProtectionLegislative • Require proper occupant restraints in all seating positions to address at-risk demographic groups • Iowa’s front seatbelt law compliance rate for occupants is 90 percent. • Still, nearly 50 percent of people who die in Iowa crashes are not wearing safety belts. • Rear seating positions aren’t markedly safer • Frequently at-risk back seat riders include: • Children between car-seat age and driving age • Teen passengers • Older persons
Top 5 Policy Strategies Motorcycle SafetyLegislative • Restore a motorcycle helmet law. • Beginning operators • All operators • Iowa is one of just four states in thenation with no motorcycle safety law Recent crash data: • Older riders are over-represented • 56 motorcycle fatalities 2006 • 5 died over Labor Day weekend alone
Other Strategies • Motorcycle Safety • Headlight modulators. • 05 alcohol limit • Distracted Driving • More research is underway • Technology may contribute to both the distractions and the solutions.
Top 5 Policy Strategies Law EnforcementLegislative • Provide adequate resources and staffing levels to support enforcement and adjudication of traffic safety laws Officials estimate that: • Statewide, Iowa has lost about 500, or 10 percent, of the law enforcement workforce in recent years
Top 5 Policy Strategies Traffic Safety Improvement ProgramLegislative • Increase the Iowa Traffic Safety Improvement Program funding from one half of one percent (1/2 percent) to a full one percent (1 percent) of the state’s Road Use Tax Fund • Could include provisions to ensure adequate local project funding • Could include language to support CHSP goals