Comprehensive Highway Safety Plan
610 likes | 860 Vues
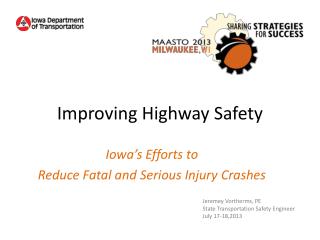
Comprehensive Highway Safety Plan. presented by Duane Williams, MDT Carol Strizich, MDT Missoula, Montana February 6, 2007. All Highway Users in Montana Arrive Safely at Their Destinations. The Vision… . Comprehensive Highway Safety Plan. What is a CHSP Why do we need one

Comprehensive Highway Safety Plan
E N D
Presentation Transcript
Comprehensive Highway Safety Plan presented byDuane Williams, MDT Carol Strizich, MDT Missoula, Montana February 6, 2007
All Highway Users in Montana Arrive Safely at Their Destinations The Vision…
Comprehensive Highway Safety Plan • What is a CHSP • Why do we need one • What does it take • Who is involved • What does the data tell us • What are the Goals • Emphasis areas • Plan Implementation Process
What is a Comprehensive Highway Safety Plan (CHSP)? A Plan to address the State’s highway safety needs and reduce the number of crashes and their consequences. The plan must be data driven and comprehensive in nature.
Why do we Need a Comprehensive Highway Safety Plan? • TranPlan 21 - Montana’s Statewide Multimodal Transportation Policy Plan – 2002 Update Established Safety Goals for the Department • Policy Goal: Reduce the number and severity of crashes on Montana’s roadways • Policy Goal: Establish and maintain high-level statewide interagency coordination to improve traveler safety and develop and agenda for action. • SAFETEA-LU Requirement
Why do we Need a Comprehensive Highway Safety Plan? • Establish specific, quantifiable safety-related goals, objectives and performance measures relevant to travel on Montana’s highways • Address issues at all levels of jurisdiction with specific attention to local and tribal entities • Establish a mechanism for interagency coordination with respect to issues of safety and develop the necessary partnering process • Provide a strategic implementation plan with short, mid and long-term action items, including action items which can be incorporated into MDT’s plans and programs and those of other state and local agencies with functional responsibilities relevant to highway safety.
What Does It Take? • Collaboration and Coordination • Working with all appropriate stakeholders with a vested interest in each safety area • Data Driven Decision Making • Continual analysis of data to direct and focus efforts • Comprehensive Strategies • Efforts need to include education, enforcement, engineering and emergency services elements
Comprehensive Approach • Highway safety problems are complex • 4 E’s - Engineering, education, enforcement and emergency services • Often times it is a combination of these that make the difference
Who does it involve • Local, State and Federal Agencies • Tribal governments • Safety Stakeholders and people with an interest or expertise in transportation safety
Montana’s Safety Stakeholders MDT – Engineering MDT – Planning MCS MDT – Maintenance MDT – SHTSO DPHHS EMS OPI DOJ MHP MVD Local Law Enforcement Courts Judiciary FHWA NHTSA Tribal Planners Indian Health Tribal Police Tribal Governments AAA MT/WY Tribal Leaders CouncilMMCA BIA
Montana’s Plan – Next Step… • Set an Overall Safety Vision • Establish Goals – What does the data tell us the problem is? • Determine Emphasis Areas (objective areas) • Identify Strategies that will reduce the number and severity of crashes and help us reach our goals
43,220 Fatalities Nearly 3M Injuries $230B+ Cost to the Nation $820.00 per person
262 Fatalities 4446 Injuries $.780B Cost to the State
How does this Break Down in Montana • Distracted driving (25%) • Impaired driving (41%) • Roadway departures (38%) • Speeding (31%) • Failure to wear safety belts (59% unrestrained) • Intersections (21%) • Pedestrians (11%) • Pedalcyclists (2%) • Trucks (11%) • Motorcycles (8%)
Montana Statewide Crash Rates (Per Vehicle Miles Traveled) 2.01 2.26 0.83
Scenarios # Of fatalities plus incapacitating injuries Target reduction from 2004 Projected # of fatalities (14%) Fatality rate (#of fatalities per 100 million vehicle miles) Traffic Safety Goals(Fatalities & Incapacitating Injuries) Realistic 1,700 -100 238 2.03 Quadratic regression 1,600 -200 224 1.91 Optimistic 1,500 -300 210 1.79 Target year 2008
Scenarios # Of fatalities plus incapacitating injuries Target reduction from 2004 Projected # of fatalities Fatality rate (#of fatalities per 100 million vehicle miles) Realistic 1.500 -300 210 1.60 Quadratic regression 1,300 -500 182 1.38 Optimistic 1,100 -700 154 1.17 Idealistic 950 -850 132 1.00 Traffic Safety Goals(Fatalities & Incapacitating Injuries) Target year 2015
CTSP Goals – We asked ourselves • Based on the data and trends, are these goals realistic? • How do we measure our progress towards these goals? • Numbers • Rates • % Decrease • Do we agree that these goals should guide the development and implementation of Montana’s Comprehensive Transportation Safety Plan?
Our Goals • Reduce the Montana statewide fatality rate from 2.05 per 100 million vehicle miles traveled (VMT) (2004) to 1.79 per 100M VMT by 2008; • Reduce the Montana statewide fatality rate to 1.0 per 100M VMT by 2015; and • By reducing the goal of the Montana fatality rate to 1.0 per 100M VMT by 2015, Montana’s incapacitating injuries will also fall from 1,700 in 2005 to 950 in 2015.
Montana’s Plan – Next Step… • Set an Overall Safety Vision • Establish Goals – What does the data tell us the problem is? • Determine Emphasis Areas (objective areas) • Identify Strategies that will reduce the number and severity of crashes and help us reach our goals
Montana’s Emphasis Areas • Increase safety belt use to 90% • Reduce alcohol and drug impaired crashes • Reduce Native American crashes • Reduce and mitigate the consequences of single vehicle run-off-the-road crashes • Develop and implement a comprehensive crash reporting and data management system • Reduce young driver (under age 21) crashes • Reduce crashes in high crash corridors and locations • Reduce crashes involving trucks • Develop an effective and integrated EMS delivery system • **Reduce crashes in urban areas • **Reduce motorcycle crashes • **Reduce older driver crashes
Increase Safety Belt Usage to 90% Current Montana rate is near U.S. average (80% - 2005) but only 24.8% of occupant fatalities were belted in 2005 Performance Measures: • Annual statewide safety belt utilization for all roads • Annual restraint use by occupant fatalities
Seat Belt Usage All Roads/ Belt Use for Occupant Fatalities 2000 75.6% / 29.4% 2001 76.3% / 26.8% 2002 78.4% / 23.5% 2003 79.5% / 28.0% 2004 80.9% / 25.1% Increase Safety Belt Usage to 90% 82.00% 35.00% 81.00% 30.00% 80.00% 25.00% 79.00% 78.00% 20.00% Seat Belt Usage All Roads 77.00% Fatalities Restraint Use for Occupant 15.00% 76.00% 75.00% 10.00% 74.00% 5.00% 73.00% 72.00% 0.00% 2000 2001 2002 2003 2004 Seat Belt Usage All Roads Restraint Use for Occupant Fatalities
Increase Safety Belt Usage to 90% - New Strategies • Enact a Primary Safety Belt Law • Conduct Targeted Education/Enforcement in Low Belt Use Locations • Implement a Safety Belt Use Incentive Program
Reduce Statewide Alcohol-Related Fatal Crashes Montana has highest alcohol-related fatality rate in U.S. for second year in a row. In 2004, 46.3% of all Montana Traffic fatalities were alcohol-related. Performance Measures: • Total annual alcohol and drug fatalities • Annual alcohol and drug related fatality rate (per 100M VMT) • Annual alcohol and drug related fatalities as a percent of all traffic fatalities
Impaired DrivingAlcohol Related Fatalities per 100 Million VMT, Montana, 1982-2002 Rate 4.0 MT Alcohol Related U.S. Alcohol Related MT Total U.S. Total 3.5 3.0 2.5 2.0 1.5 1.0 0.5 0.0 ‘82 ‘83 ‘84 ‘85 ‘86 ‘87 ‘88 ‘89 ‘90 ‘91 ‘92 ‘93 ‘94 ‘95 ‘96 ‘97 ‘98 ‘99 ‘00 ‘01 ‘02 Year
Alcohol-related Fatalities As % of All Fatalities 2000 117 / 49.4% 2001 104 / 45.2% 2002 126 / 46.8% 2003 128 / 48.9% 2004 106 / 46.3% Reduce statewide alcohol-related fatal crashes and serious injury crashes 1.25 49.50% 49.00% 1.2 48.50% 1.15 48.00% 47.50% Alcohol related fatality rate (per 100 M VMT) 1.1 of all fatalities Alcohol related fatalities as % 47.00% 1.05 46.50% 46.00% 1 45.50% 0.95 45.00% 2000 2001 2002 2003 2004 Alcohol related fatality rate (per 100 M VMT) Alcohol related fatalities as % of all fatalities
New Strategies For Alcohol/Drug Impaired Crash Reduction • Establish stronger penalties for BAC test refusal • Monitor DUI offenders • Add notice onto CMV license for any incidence of failed drug/alcohol/DUI test
Reduce Native American traffic fatalities Native American are disproportionately represented in fatality statistics – Native Americans make up 6.2% of Montana’s population yet in 2005 they accounted for 13.5% of the State’s fatalities. Performance Measures: • Total annual Native American traffic fatalities. • Annual Native American traffic fatalities as a percent of all Montana traffic fatalities
Native American Traffic Fatalities As % of Total Traffic Fatalities 2000 35 / 14.8% 2001 37 / 16.1% 2002 51 / 19.0% 2003 42 / 16.0% 2004 45 / 19.7% Reduce Native American traffic fatalities 60 25.00% 50 20.00% 40 15.00% Native American Traffic Fatalities 30 Native American Traffic 10.00% Fatalites as % Total Fatalities 20 5.00% 10 0 0.00% 2000 2001 2002 2003 2004 Native American Traffic Fatalities Native American Traffic Fatalites as % Total Fatalities
Reduce Native American traffic fatalities – New Strategies • Establish Systems/Policies to Support Data Sharing among Tribal, State, Local Entities • Encourage Cross-Deputization of Law Enforcement among Tribal, State, Local Entities • Adopt Uniform Traffic Codes Incorporating Montana Statutes • Provide POST Credits for Tribal and BIA Officers • Develop Comprehensive Safety Plans for Each Reservation, Incorporating or being led by DUI Task Force
Reduce and mitigate the consequences of single vehicle run-off-the-road fatal and serious injury crashes From 1995 to 2004, 48-60% of Montana’s fatal crashes involved a single vehicle running off the road. Performance Measures: • Total annual single vehicle run-off-the-road crashes • Total annual single vehicle run-off-the-road fatal crashes
Single-Vehicle ROR Fatal Crashes As % of All Fatal Crashes 2000 99 / 48.8% 2001 108 / 53.7% 2002 136 / 58.6% 2003 139 / 58.2% 2004 126 / 60.3% Reduce and mitigate the consequences of single vehicle run-off-the-road fatal and serious injury crashes 65.0% 145 135 60.0% 125 Single vehicle ROR fatal 115 crashes 55.0% all fatal crashes Single vehicle ROR as % of 105 95 50.0% 85 75 45.0% 1995 1996 1997 1998 1999 2000 2001 2002 2003 2004 Single vehicle ROR fatal crashes Single vehicle ROR as % of all fatal crashes
Reduce and mitigate the consequences of single vehicle run-off-the-road fatal and serious injury crashes – New Strategies • Route Segment Plan/Shoulder Width • Pavement Marking/Rumble Strips • Establish a Comprehensive, Multiagency Policy in High-Incidence Locations • Conduct Targeted Public Awareness Campaigns
Develop and Implement a Comprehensive and Coordinated Crash Reporting System Fundamental need to collect, manage, and utilize all aspects of safety data Performance Measures: • Implementation of specific CHSP strategies for traffic records management • Implementation of specific strategies contained in Traffic Records Strategic Plan
Develop and Implement a Comprehensive and Coordinated Crash Reporting System – New Strategies • Implement the Action Plan in the Traffic Records Strategic Plan • Facilitate Electronic Data Capture • Establish a Data Warehouse • Encourage Tribal Data Sharing
Reduce Young Driver (Under Age 21) Fatal and Serious Injury Crashes In 2005 – drivers under the age of 21 experienced 117 crashes per 1,000 licenses. This is triple the crash rate and 50% higher than the fatal crash rate than for drivers who are 21 and older. Performance Measures: • Total annual young drivers in crashes • Annual young driver crash rate (per 1,000 licenses) • Total annual young drivers in fatal crashes • Annual young driver fatal crash rate (per 1,000 licenses)
Young Driver (under 21) Fatalities As % of All Fatalities 2000 49 / 20.7% 2001 40 / 17.4% 2002 47 /17.5% 2003 57 / 21.2% 2004 39 (0.63) / 17.0% Reduce young driver (under age 21) fatal and serious injury crashes 8,400 25.0% 8,200 8,000 20.0% 7,800 7,600 15.0% Young drivers in crashes (per 1000 licenses) 7,400 Young driver fatalities & rate (per 1000 licenses)/ as % of all fatalites 7,200 10.0% 7,000 6,800 5.0% 6,600 6,400 0.0% 2000 2001 2002 2003 2004 Young drivers in crashes (per 1000 licenses) Young driver fatalities & rate (per 1000 licenses) as % of all fatalities
Reduce Young Driver (Under Age 21) Fatal and Serious Injury Crashes – New Strategies • Reintroduce Traffic Safety Education in Elementary and Junior High Schools • Enact a Primary Safety Belt Law • Provide affordable/Accessible Drivers Education in all Schools • Develop a Role and Strategy for Law Enforcement in GDL
Reduce All Crashes in High Crash Corridors and Locations Performance Measures: • Average annual number of crashes in identified high-crash corridors/locations • Annual severity rate of crashes in identified high-crash corridors/locations
Reduce All Crashes in High Crash Corridors and Locations – New Strategies • Review Guidelines for Pavement and Shoulder Widths/Review Side Slopes • Develop Guidelines Six-inch Pavement Markings/Longer-Lasting Pavement Markings • Conduct Road Safety Audits • Implement ITS Technologies • Conduct Proactive Safety Efforts
Reduce fatal and serious injury crashes involving trucks Crashes involving trucks tend to result in greater likelihood of fatalities Performance Measures: • Total annual crashes involving trucks • Total annual fatal crashes involving trucks • Annual crashes involving trucks as a percent of all crashes
Fatal Crashes Involving Trucks As % of All Fatal Crashes 2000 24 / 11.9% 2001 25 / 12.4% 2002 20 / 8.6% 2003 21 / 8.8% 2004 15 / 7.2% Reduce fatal and serious injury crashes involving trucks 6.2% 13.0% 6.0% 12.0% 5.8% 11.0% Crashes involving trucks (% of all crashes) 5.6% 10.0% crashes trucks / as % of all fatal Fatal crashes involving 5.4% 9.0% 5.2% 8.0% 5.0% 7.0% 2000 2001 2002 2003 2004 Crashes involving trucks / as % of all crashes Fatal crashes involving trucks / as % of all fatal crashes
Reduce fatal and serious injury crashes involving trucks – New Strategies • Conduct a Motor Carrier Industry Training Survey • Facilitate Inspector Certification • Facilitate Compliance Review and Safety Audit Certification • Provide Training for New Commercial Carriers
Develop an Effective and Integrated Emergency Medical Services (EMS) System Effectively utilize available resources and address Montana’s unique EMS needs Performance Measures: • Implementation of CHSP EMS strategies • Implementation of EMS strategies contained in Montana EMS System Plan
Develop an Effective and Integrated Emergency Medical Services (EMS) System – New Strategies • Establish EMS Legislation and Regulation • Provide EMS Funding • Enhance Capabilities for Medical Response to Disaster • Expand EMS Human Resources • Enhance EMS Education System • Expand EMS Services • Facilitate EMS Communications • Conduct EMS Public Education and Information Programs