Download
1 / 33
340 likes | 507 Vues
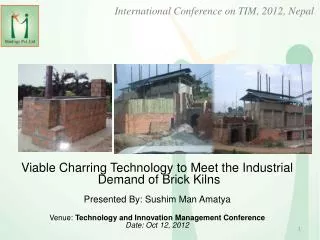
Viable Charring Technology to Meet the Industrial Demand of Brick Kilns Presented By: Sushim Man Amatya Venue : Technology and Innovation Management Conference Date: Oct 12, 2012. Overview of Brick Industries.

E N D
Viable Charring Technology to Meet the IndustrialDemand of Brick Kilns Presented By: Sushim Man Amatya Venue: Technology and Innovation Management Conference Date: Oct 12, 2012
Overview of Brick Industries • 436 brick kilns registered with total production capacity of 872 million, Census of manufacturing establishments, Nepal 2006-2007 • About 700 brick kilns in Nepal (Source: All Nepal Brick Kiln Entrepreneurs Association, 2011) • Estimated total annual production capacity of about 1,423 million bricks • Coal is the major fuel .
Major Brick Kiln Technologies Clamp Moving Chimney BTK (MCBTK) VSBK Fixed Chimney BTK (FCBTK)
Case of Brick Industries in Kathmandu Valley • 80,000 tones of coal is consumed annually by 120 brick kilns within Kathmandu valley out of 700 in Nepal. • 1.12 billion Rupees are spent in India. Yet the quality and supply of coal is unreliable. • Emission of 200,000 tones CO2 annually by brick kilns in the valley. (1kg. Coal = 2.465 kg. CO2 )
Kathmandu Valley & FCBTKs Total No of Kilns: 108 Source: 103 FCBTKs - All Nepal Brick Kiln Entrepreneurs Association, 2011. 3 VSBK units and 2 Hoffman Kilns. No of FCBTKs: 103 Average brick production per year: 720 million Average brick production per kiln is estimated to be 7 million per kiln Annual coal consumption in FCBTKs(Tons): 68,500 Average coal consumption per brick in FCBTK in Kathmandu Valley is estimated to be 95gm per brick Annual expenditure in coal (NRs): 1.23 billion Price of coal – Nrs21,000 per ton, March 2012, Brick Entrepreneurs Annual CO2 emission (Tons): 169,000 2.465 Kg of CO2 is emitted per Kg of coal fired, Project Design Document for VSBK Annual emission of dust particles (Tons): 1800 2.51 Kg of SPM per 1000 fired bricks in FCBTKs, Stack and Energy Monitoring of Brick Kilns in Kathmandu Valley, IEM 2005
Energy • Coal is major fuel used in the brick production. • Other non coal fuel such as agricultural residue, firewood, • rice husk, saw dust etc • Coal consumption per lakh bricks in the FCBTK is 15.45 tons and MCBTK 14.18 tons (CEN Baseline report, 2009).
Energy • Dependency on imported coal • In 2008/09, Nepal imported about 293,000 tons of coal from India. KTM alone consumed about 40% of imported coal. It is mainly used in the industrial sector mainly in the brick kilns and cement factory • Rising coal price is 200% increment in 6 years without considering inflation, • (NRs 7.3 in 2006 and NRS 22 in 2012 per kg of coal ).
In-depth into the issues Environmental issues Prime source of air pollution 2nd largest air polluter in the valley 2.5kg dust emission per 1000 fired bricks (Average dry wt of bricks = 2.2 Kg) Serious occupational health hazards Emission of RPM-PM higher than prescribed limit, in some cases 7 times more than limit 1,600 die of air pollution every year in Kathmandu Valley, People’s Daily Online, Feb 2008
In-depth into the issues Climate change issues One of the prime source of CO2 and Black Carbon emission Burning a Kg of coal emits about 2.5 Kg CO2 – major GHG Brick kilns have also been identified as one of the prime cause for BC emission – primary cause of melting Himalayan glaciers (ICCT 2009)
More than 15300 CFUGs, 40% of total households of Nepal, own and manage community forests in 1,22,000 hectare of land. The potentials of economic return from the community forests are under-utilized mainly due to lack of knowledge, efficient technology and market linkage for forest-based products. The current demand for char is low and the income generated does not even cover the minimum wage or opportunity cost.
Our experiences with internal fuel in VSBK Environmental performance 37 % less 18% less The results are based on the applied research carried out in a VSBK plant The research was carried out by firing 75,000 bricks with three different fuel composition in a VSBK shaft. Results are derived by scientific monitoring of stack emission and energy performance.
Our experience with internal fuel in VSBK Energy performance & brick quality 16% less energy consumption 22% improvement in strength
Potentials • 10% improvement in energy efficiency can result into • Reduction of 6900 tons of coal • Annual saving of NRs 125 million in coal cost • Reduction of 17000 tons of CO2 • 20% improvement in environmental performance can result into • Reduction of 275 tons of mass emission load • Improvements in occupational health and safety status • Reduction in black carbon emission
Potentials/Scope • Kathmandu Valley & FCBTKs • Improvements in occupational health and safety status • Reduction in black carbon emission • Viable for small-scale CDM
Missing Links According to action research conducted , biomass based carbonized fuel (char) generated from non timber woody plants and forest waste can be used for brick firing instead of coal in brick industries
Green Brick Making with Internal Fuel Collection of Char and CV test (Coal and Char) (About 5 tons of char has been collected) Baseline study to calculate the Specific Energy Consumption (SEC) SEC = 0.48 MJ/ kg of fired brick Calculation of char quantity in terms of energy value 40% coal substitution = 0.011 kg/brick 50% coal substitution = 0.014 kg/brick 60% coal substitution = 0.017 kg/brick 70% coal substitution = 0.020 kg/brick • Green brick making with internal fuel as • Char mixing • Soil ageing • Green Brick Making (on process)`
Fixed Type Charring Retort Fig: Schematics of the fixed type charring retort
Other Potentials • Establishment of market links for industrial demand • Efficiency of char production technology increased by at least 20% • Increment of income from the increased efficiency is at least 40% • Improved occupational health safety for char producers • Increased income opportunity for disadvantaged members of CFUGs • Potentials using char in other SMEs