110
His-XLG3C. His-XLG2C. His-XLG1C. 207. 79. 49. 32. 25. XLG3C. XLG1C. XLG2C. kDa. 207. 110. 79. 49. 32. 25. His-T475N. A. B. His-GPA1. His-XLG2C. His-RTV1. TRX. kDa. kDa. 110. 79. 110. 49. 32. 25. 15. C. D. His-XLG3. His-XLG2. His-XLG1. kDa. 207. 110. 79.

110
E N D
Presentation Transcript
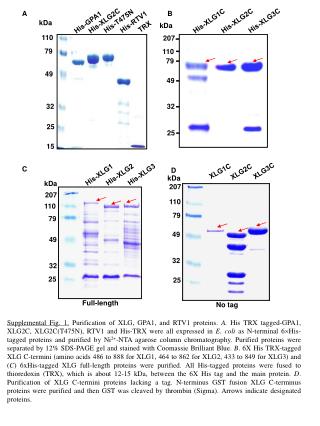
His-XLG3C His-XLG2C His-XLG1C 207 79 49 32 25 XLG3C XLG1C XLG2C kDa 207 110 79 49 32 25 His-T475N A B His-GPA1 His-XLG2C His-RTV1 TRX kDa kDa 110 79 110 49 32 25 15 C D His-XLG3 His-XLG2 His-XLG1 kDa 207 110 79 49 32 25 Full-length No tag Supplemental Fig. 1. Purification of XLG, GPA1, and RTV1 proteins.A. His TRX tagged-GPA1, XLG2C, XLG2C(T475N), RTV1 and His-TRX were all expressed in E. coli as N-terminal 6His-tagged proteins and purified by Ni2+-NTA agarose column chromatography. Purified proteins were separated by 12% SDS-PAGE gel and stained with Coomassie Brilliant Blue. B. 6X His TRX-tagged XLG C-termini (amino acids 486 to 888 for XLG1, 464 to 862 for XLG2, 433 to 849 for XLG3) and (C) 6xHis-tagged XLG full-length proteins were purified. All His-tagged proteins were fused to thioredoxin (TRX), which is about 12-15 kDa, between the 6X His tag and the main protein. D. Purification of XLG C-termini proteins lacking a tag. N-terminus GST fusion XLG C-terminus proteins were purified and then GST was cleaved by thrombin (Sigma). Arrows indicate designated proteins.
A -GTPS GDP ATP GDP ▶ GTP ▶ 0 2 2 2 2 Time (h) B XLG2 full XLG2C (no tag) GDP ▶ GTP ▶ 0 15 60 120 0 15 60 120 Time (min) C 100 80 GTP remaining (%) 60 40 20 0 15 60 120 Time (min) Supplemental Fig. 2. Like XLG2C 6X His TRX-tagged protein, XLG2 full-length 6X His TRX-tagged and XLG2C (no tag) proteins have GTPase activities in the presence of Ca2+. A. Substrate competition test of XLG2C in the presence of Ca2+. Reactions were performed as described in Fig. 2E in the presence of competitors (3 M unlabeled GTPS, GDP or ATP).B. GTPase activities of full-length XLG2 and XLG2C (no tag) in the presence of Ca2+, demonstrating that neither truncation nor tag is required for GTPase activity. C.GTPase activity of GPA1 in the presence of 10 mM Mg2+ or Ca2+.
A B XLG1C - Mg2+ Mn2+ Ca2+ 2 h GTPγS binding (%) ◀ GDP ◀ GTP 0 2 2 2 2 Time (h) Ca2+ Mg2+ D C 2 h 100 ◀ GDP 80 GTP hydrolysis (%) 60 40 ◀ GTP 20 0 XLG1C GTPS GDP ATP None S497N XLG1 full Competitor Supplemental Fig. 3.XLG1 has GTP binding and GTPase activities in the presence of Ca2+. A.[35S]GTPS binding to XLG1C, its mutant and GPA1 in the presence of CaCl2 or MgCl2. Amount of [35S]GTPS binding to XLG2, its mutant form XLG1C(S497N) and GPA1 was measured after a 2 hour incubation in the presence of CaCl2 or MgCl2. B. GTPase activity of XLG1Cin the presence of different cofactors, showing preference for Ca2+. C. GTPase activity of full-length XLG1, XLG1C and XLG1C(S497N) in the presence of Ca2+. D. Substrate competition test of XLG1Cin the presence of Ca2+, showing specificity for GTP.
A B XLG3C - Mg2+ Mn2+ Ca2+ GTPγS binding (%) ◀ GDP ◀ GTP 0 2 2 2 2 Time (h) Ca2+ Mg2+ C D 2 h ◀ GDP 100 80 GTP hydrolysis (%) 60 ◀ GTP 40 20 XLG3C S444N XLG3 full 0 None GTPS GDP ATP Supplemental Fig. 4.XLG3 has GTP binding and GTPase activities in the presence of Ca2+. A.[35S]GTPS binding to XLG3C, its mutant form XLG3C(S444N) and GPA1 in the presence of CaCl2 or MgCl2. Amount of [35S]GTPS binding to XLG3C, its mutant and GPA1 was measured after 2 hour-incubation in the presence of CaCl2 or MgCl2. B.GTPase activity of XLG3Cin the presence of different cofactors, showing preference for Ca2+. C. GTPase activity of full-length XLG3, XLG3C and XLG3C(S444N) in the presence of Ca2+. D. Substrate competition test of XLG3Cin the presence of Ca2+, showing specificity for GTP.
65 60 55 50 45 40 Fold change 35 30 25 20 15 10 5 0 Cold treatment (Time) Supplemental Fig. 5.RTV1 mRNA expression is up-regulated by vernalization. Expression of RTV1 and XLG2 under cold treatment. RTV1 and XLG2 transcript levels were normalized to ACTIN2 levels using the formula CT = CT(each gene) – CT(ACTIN2). One-week old Col seedlings on plates were treated with the indicated duration of cold treatment (4C). Real-time PCR was used to determine the level of RTV1 mRNA expression. Relative fold changes were shown compared between cold-treated and no cold-treated Col plants with no cold-treated plants set equal to 1.RD29A was used as a positive control for a cold responsive gene(Zhu et al., 2004) and the repression of FLC was used as a positive control for a vernalization responsive gene(Sung and Amasino, 2004)
RTV1 (µg) 0 0.5 1 Protein-DNA complex Free probe Supplemental Fig. 6.RTV1 binds to a DNA fragment from the DFR promoter, which is not flowering-related. Electrophoretic mobility shift assay (EMSA) of RTV1 using 400 bp DFRpromoter-derived DNA fragment. RTV1 protein (0-28 nM; 0-1 g) and 400-bp radiolabelled double-stranded DFR probe were incubated and then separated on a 5% tris-borate EDTA-polyacrylamide gel.