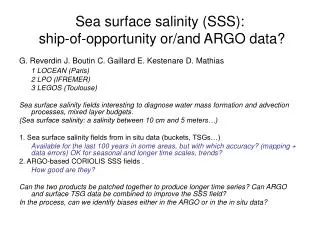
Sea Surface Salinity Measurement from Space: Aquarius Instrumentation Studies
100 likes | 139 Vues
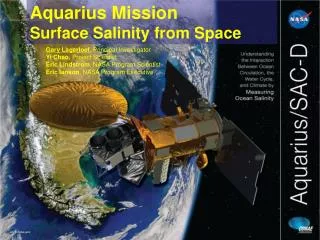
Explore Aquarius, a system measuring sea surface salinity from space to understand ocean circulation and interactions. Simulation at NASA GSFC for algorithm testing and error assessment. Data supports Aquarius mission's ground processing.

Sea Surface Salinity Measurement from Space: Aquarius Instrumentation Studies
E N D
Presentation Transcript
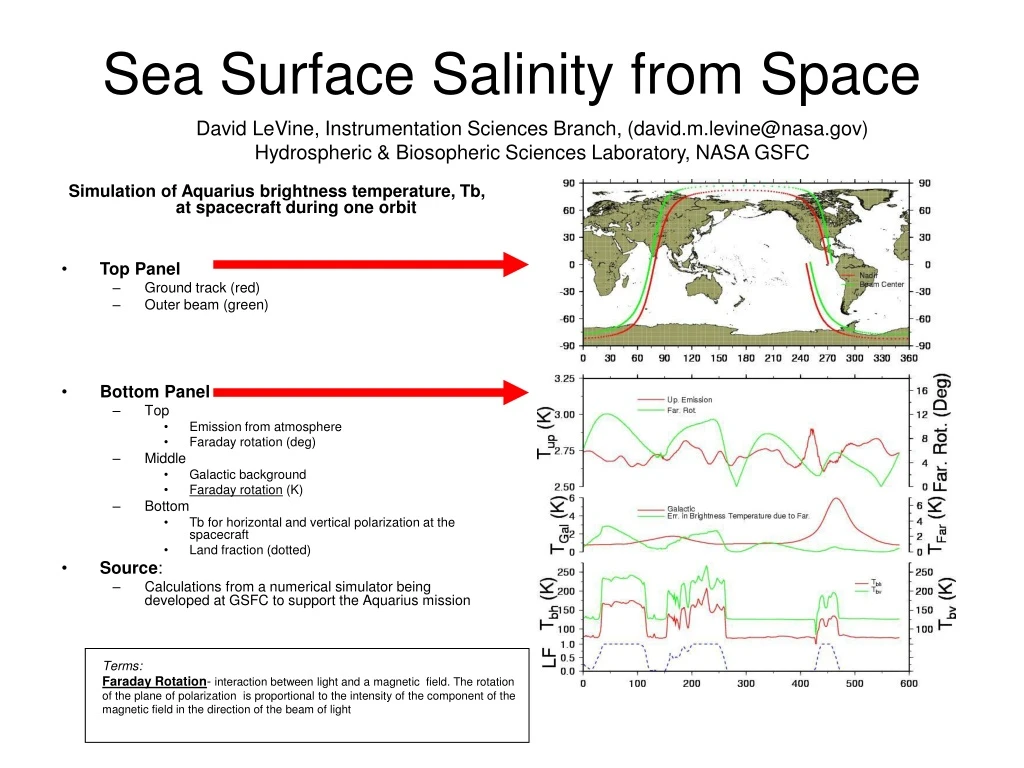
Sea Surface Salinity from Space David LeVine, Instrumentation Sciences Branch, (david.m.levine@nasa.gov) Hydrospheric & Biosopheric Sciences Laboratory, NASA GSFC Simulation of Aquarius brightness temperature, Tb, at spacecraft during one orbit • Top Panel • Ground track (red) • Outer beam (green) • Bottom Panel • Top • Emission from atmosphere • Faraday rotation (deg) • Middle • Galactic background • Faraday rotation (K) • Bottom • Tb for horizontal and vertical polarization at the spacecraft • Land fraction (dotted) • Source: • Calculations from a numerical simulator being developed at GSFC to support the Aquarius mission Terms: Faraday Rotation-interaction between light and a magnetic field. The rotation of the plane of polarization is proportional to the intensity of the component of the magnetic field in the direction of the beam of light
Sea Surface Salinity from Space: Aquarius • Aquarius: • An L-band instrument system to measure sea surface salinity from space • Active/Passive combination (radiometer at 1.4 GHz, scatterometer at 1.2 GHz) • Salinity is important for understanding ocean circulation and ocean-atmosphere interaction • Simulation being developed at GSFC to: • Test assumptions • Verify science retrieval algorithms • Asses sources of error (Faraday rotation, background radiation, surface roughness, etc.) • Provide test data to the Aquarius ground data processing system • Example (accompanying slide): • Consistent ocean model (HYCOM) and atmosphere profiles (NCEP) are input • Integration over model antenna with realistic wind, SST and SSS fields • Status: • Sun interference and scatterometer response are being added • The model antenna is being replaced with the actual antenna (numerically calculated pattern) Terms: Scatterometer- An instrument used to determine the absolute or relative scatter levels of optical surfaces HYCOM-HYbrid Coordinate Ocean Model NCEP-National Centers for Environmental Prediction
2003-2005 Operations Periods Christopher Shuman, Cryospheric Sciences Branch, (christopher.a.shuman@nasa.gov) Hydrospheric & Biospheric Sciences Laboratory, NASA GSFC ICESat’s first seven operational periods are summarized above. The seventh period has just concluded using GLAS Laser 3. The next period will be in October/November 2005.The elevation data for the globe and the Antarctic and Arctic regions that have been gathered up to the Laser 3c period are summarized in the following graphics.
Assessment of EOS Aqua AMSR-E Arctic Sea Ice Concentrations Using Landsat 7 Imagery D. J. Cavalieri, T. Markus, D. K. Hall, A.Ivanoff Hydrospheric and Biospheric Sciences Laboratory (Donald.J.Cavalieri@nasa.gov) Fig. 1 Research: During March 2003 coordinated satellite, aircraft, and surface-based sea ice measurements were made in the Alaskan Arctic for the purpose of validating the Aqua Advanced Microwave Scanning Radiometer for EOS (AMSR-E) sea ice products including sea ice concentration,snow depth on sea ice,and ice temperature. The data sets used to validate AMSR-E sea ice concentrations were derived from the airborne NOAA/ETL Polarimetric Scanning Radiometer and Landsat 7 Enhanced Thematic Mapper Plus (ETM+) imagery. Results for March 13, the first day we had clear Landsat imagery during the field campaign, are presented. Fig. 1 shows the AMSR-E Bering Sea ice concentration map for March 13 with the area of Landsat 7 coverage indicated. Observations: The results suggest that the largest and most numerous AMSR-E ice concentration errors relative to Landsat occur in areas of new ice production. Landsat 7 coverage NASA Wallops P- 3B in Fairbanks, AK Fig 1. AMSR-E Bering Sea Ice Concentration-March 13, 2003
Landsat 7 ETM+ March 13, 2003 Fig. 4 Fig. 2 St. Lawrence Is. Ice Edge Pixels Polynya Pixels (AMSR-E – Landsat) Mean Diff. = -1.5% SD of the Diff. = 6.4% RMS of the Diff.= 6.6% St. Matthew Is. Ice Edge Bering Sea Fig 2. ETM+band 8 albedos Fig 4. A scatter plot of the March 13 AMSR-E-Landsat comparisons Fig. 3 Table 1. Landsat/AMSR-E ice concentration comparison by surface type (surface-type purity >90% for 12.5 km pixels) for March 13, 2003. Fig 3. Landsat 7 ETM+ Classification of Ice Types Red=FY ice, Green=Young ice, Blue=New ice
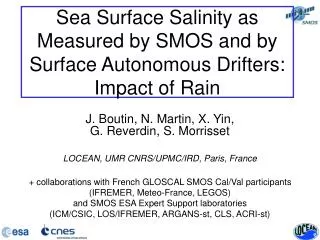
Simulated Surface Salinity for December 2004 David Adamec, Ocean Sciences Branch, Hydrospheric & Biospheric Sciences Laboratory, Earth-Sun Exploration Division (David.D.Adamec@nasa.gov) • A state-of-the-art ocean circulation model is used to simulate the ocean’s response to atmospheric forcing. Of particular interest is the salinity variability south of the equator off the South American coast. It is thought that salinity anomalies generated there are subducted and then propagate to the western equatorial Pacific. The vertical stratification change due to these salinity anomalies affect the dynamics of the warmest surface waters in the global ocean, and likely affect the generation of interseasonal variability such as El Niño and La Niña. • This research directly supports AQUARIUS mission science goals, and goals related to NASA’s Modeling and Prediction (MAP) program. Terms: Anamolies-deviations from the common rule, type, or form; something abnormal or inconsistent Subducted-pulled or drawn downward Propagate-to cause to extend to a broader area or larger number Stratification-the process by which materials form or are deposited in layers