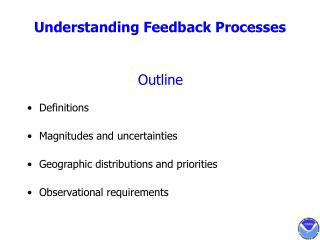
Understanding Uncertainty and Feedback
Understanding Uncertainty and Feedback. Reading for Week 8 Lecture 15 Understanding uncertainties and feedbacks. GW Chapter 3, 5 IPCC WG1 Chapter 8: pp 3-9, 41-45, 91-92. CLIM 101: Weather, Climate and Global Society. Uncertainty . Sources of Uncertainty: Observations. Instrument error


Understanding Uncertainty and Feedback
E N D
Presentation Transcript
Reading for Week 8Lecture 15Understanding uncertainties and feedbacks • GW Chapter 3, 5 • IPCC WG1 Chapter 8: pp 3-9, 41-45, 91-92
CLIM 101: Weather, Climate and Global Society Uncertainty
Sources of Uncertainty: Observations • Instrument error • Sparse, infrequent measurements - inadequate sampling or sampling bias • Observing system change over time • Mixing direct measurements and proxy measurements
URBAN HEAT ISLAND EFFECT full US Historical Climatology Network (USHCN) data USHCN data without the 16% of the stations with populations of over 30,000 within 6 km in the year 2000 • UHI and changes in land use can be important for DTR at the regional scale • The global land warming trend is unlikely to be influenced significantly by increasing urbanization. USHCN data for the 16% of the stations with populations over 30,000 Full USHCN set minus the set without the urban stations
Cooling Increased post-WWII pollution in NH? • ------- Little change ---- Variability due to solar changes, volcanism • Warming Increasing GHG
Slope = 1.02 Slope = 1.67 Slope = 1.01 Slope = 1.82 Synthetic time series example: Need large samples to avoid “end effects” in estimating linear trends
Sources of Uncertainty: Models • Input data (forcing) uncertainty • Differing assumptions with respect to relevant processes • Differing estimates of model parameters • Intrinsic unpredictability • Unpredictability of external phenomena (e.g. volcanoes)
Climate Models – Thermosteric Sea Level Change Without Volcanoes With Volcanoes Domingues et al. 2008
Global mean sea level (deviation from the 1980-1999 mean) Uncertainty in estimated long-term rate of sea-level change Based on tide gauges Based on satellite altimetry Range of model projections (SRES A1B scenario)
Climate Model Fidelity and Projections of Climate Change J. Shukla, T. DelSole, M. Fennessy, J. Kinter and D. Paolino Geophys. Research Letters, 33, doi10.1029/2005GL025579, 2006
Projected Future Warming Figure 9.13, IPCC TAR
What is in store for the future and what has already been committed Global warming will increase if GHGs concentration increase. Even if GHGs were kept constant at current levels, there is a “commitment” of 0.6°C of additional warming by 2100. CO2 Eq 3.4oC = 6.1oF 850 2.8oC = 5.0oF 600 1.8oC = 3.2oF 0.6oC = 1.0oF 400
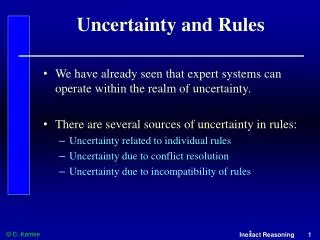
Positive vs. Negative Feedback • Something triggers a small system change • The system responds to the change • Feedback • Positive Feedback: The response accelerates the original change • Negative Feedback: The response damps the original change
Effect of Positive Feedback (1) With positive feedbacks Temperature If no feedbacks present Time
Effect of Positive Feedback (2) If no feedbacks present Temperature With positive feedbacks Time
The Need for Negative Feedbacks • Positive feedbacks are destabilizing - they tend to drive the system away from equilibrium • Negative feedbacks are required to restore equilibrium • Positive feedbacks tend to increase the magnitude of the system response • Negative feedbacks tend to reduce the magnitude of the system response
A System Without Negative Feedbacks Example “Runaway Greenhouse Effect”, T H2O T Catastrophic Warming! Temperature Time
The Way Physical Systems Usually Behave Temperature Warming Accelerating Warming Decelerating Time
Feedbacks in the Climate System • Water vapor feedback • Ice-albedo feedback • Cloud-radiation feedback • Climate-carbon cycle feedback
Water Vapor Feedback (1) Warming Evaporation from the Oceans Increases Atmospheric Water Vapor Increases Stronger Greenhouse Effect
Water Vapor Feedback (2) Cooling Evaporation from the Oceans Decreases Atmospheric Water Vapor Decreases Weaker Greenhouse Effect Water Vapor Feedback is large and positive (well understood)
Ice-Albedo Feedback (1) Cooling Ice Increases Albedo Increases Absorption of sunlight decreases
Ice-Albedo Feedback (2) Warming Ice Decreases Albedo Decreases Absorption of sunlight increases Ice-Albedo Feedback is modest and positive (well understood)
Equilibrium Climate Sensitivity (ECS) and Transient Climate Response (TCR) • Definition: The ECS is the full equilibrium surface temperature response to a doubling of CO2 • Definition: The TCR is the surface temperature response at CO2 doubling for a 1%/yr increase of CO2 (i.e. at year 70) • a. ECS and TCR are basically model concepts • b. TCR < ECS • c. ECS is a measure of the feedbacks in the system
Carbon-Climate Feedback • The plankton multiplier in the ocean (positive) • (Colder Stronger Ocean Biological Pump Remove ATM CO2) • 2. Carbon dioxide fertilization, plant growth (negative) • 3. Effect of higher temperatures on respiration (positive) • 4. Reduction of forest growth because of climate change (positive) • 5. Increased greenhouse gases due to increase of fires (positive) • 6. Release of methane from wetland and permafrost (positive)