Download
1 / 28
290 likes | 423 Vues
Understand pivot points, entry & exit signals, using daily levels and time frame convergence. Learn to employ risk/reward management. Explore John Persons Pivots versus Regular Pivots. Effective strategies for intraday, swing, and longer-term trading.

E N D
Pivot Point Trading System Introduction • Presented by Doug Allen
Presentation Outline • What are Pivot Points? • Why would you use a pivot point trading system? • When would you use the system? • How does a pivot trading system work? • Basic entry and exit signals using pivots points
What are Pivot Points? • “Potentially” key support and resistance levels • Available on Prophet Charts and TOS Charts • Base pivot calculated by High + Low + Close ÷ 3 of prior period time frame • Support 1, 2, 3 and Resistance 1, 2, 3 levels are calculated off of the base pivot level • Available on multiple time frames: Daily, Weekly and Monthly > often coincide with Fib Levels
Why would you use a pivot point trading system? • The need for a system with clearly defined entries and exits • The need for a system with well defined targets • Having clearly defined targets makes it easier to calculate risk/reward ratio • Trading intraday using “Day” pivot levels offers an abundant amount of trades
Persons vs. Regular Pivots • Persons Pivots developed by John Persons • Persons attempts to simplify and focus only on probable levels (attempts to weed out excess) • Persons available only on TOS platform • Pivot Points available on TOS and Prophet • Find what works best for you
Pivot Time Frames • Daily Pivot Levels for Intraday Trading • Weekly Levels for Swing Trading • Monthly Levels for Longer Term Trading • Todays focus will be on Daily Pivot Levels
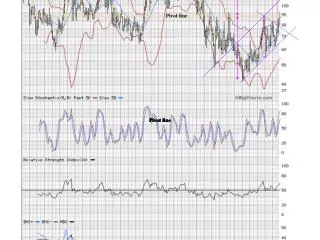
Daily Pivot Levels • Best for Intraday Trading (trends and reversals) • Can use 15 Minute Chart to determine trend • Can use 5 Minute Chart for entry / exit signals • Stronger when daily levels coincide with Weekly and/or Monthly pivot levels
Daily Levels for Intraday Trading5 Minute bars, Daily Pivot Levels - best with Regular Pivots
Weekly Levels for Swing TradingDaily Bars using Weekly Pivot Levels - best with Persons Pivots
Monthly Levels for Longer Term TradingWeekly bars with Monthly Pivot Levels - best with Persons Pivots
Confluence of Time Frames • Confluence of pivots from multiple time frames can be useful when looking for price targets or strong areas of support and resistance • Works on tops and bottoms • Professional traders are watching these levels too • Caveat: Like all other S and R levels, they don’t work all the time, but many times they do
Targets and Risk / Reward Simplified • Must have a target before calculating Risk/Reward (must have stop level too) • Must have 3 to 1 reward to risk to enter trade • Target is next pivot level, but be optimistic that it can move much more so have a plan how you will scale out of partial and let some of the winner run • Focus on the target, let the trade work for you
When would you use the system? • Trending days are good • Highly volatile days are good - lots of bounces • Avoid doji days (mixed market internals) • Don’t force trades, let them come to you • Be aware of weekly and monthly pivot levels
Entry Signals - 5 Minute Chart • Key is patience to wait for good signals • Trade only in the direction of the 15 minute trend for best results • Buy at Support • Sell at Resistance • Pivot can act as support or resistance • Use longer term technicals to assist in direction
Entry Signals - 5 Minute Chart • Buy at High Close Doji (HCD) Once a doji or bottoming candle has formed at the pivot level, wait for a candle to close completely above the trigger candle for entry • Sell at Low Close Doji (LCD) Once a dojo or topping candle has formed at the pivot level, wait for a candle to close completely below the trigger candle for entry • Confirm with 15 Minute Stochastics
Exit Signals - 5 Minute Chart • Once target is reached, exit when sell signal appears which would be a HCD or LCD at target • Alternatively, exit majority of the position at Target One and let the remaining position run incase the trade continues to work • Adjust stop to breakeven once Target One has been reached
Pre-Market Preparation • Identify the Pivot Level (available the day before) • Watch Futures to find out where market is likely to open • If it opens near support, look for a bounce up • If it opens near resistance, look for a fade down
Summary • Pivots are great levels to build a system on • Your system will likely be unique to everyone else's, adjust as you see fit • Look for buy signals at support • Look for sell signals at resistance • When the system triggers a signal, act on it. • When the system says get out, get out!
Resources • Candlestick and Pivot Point Trading Triggers by John Persons • John Persons DVD • John Persons Website www.nationalfutures.com • www.mypivots.com